
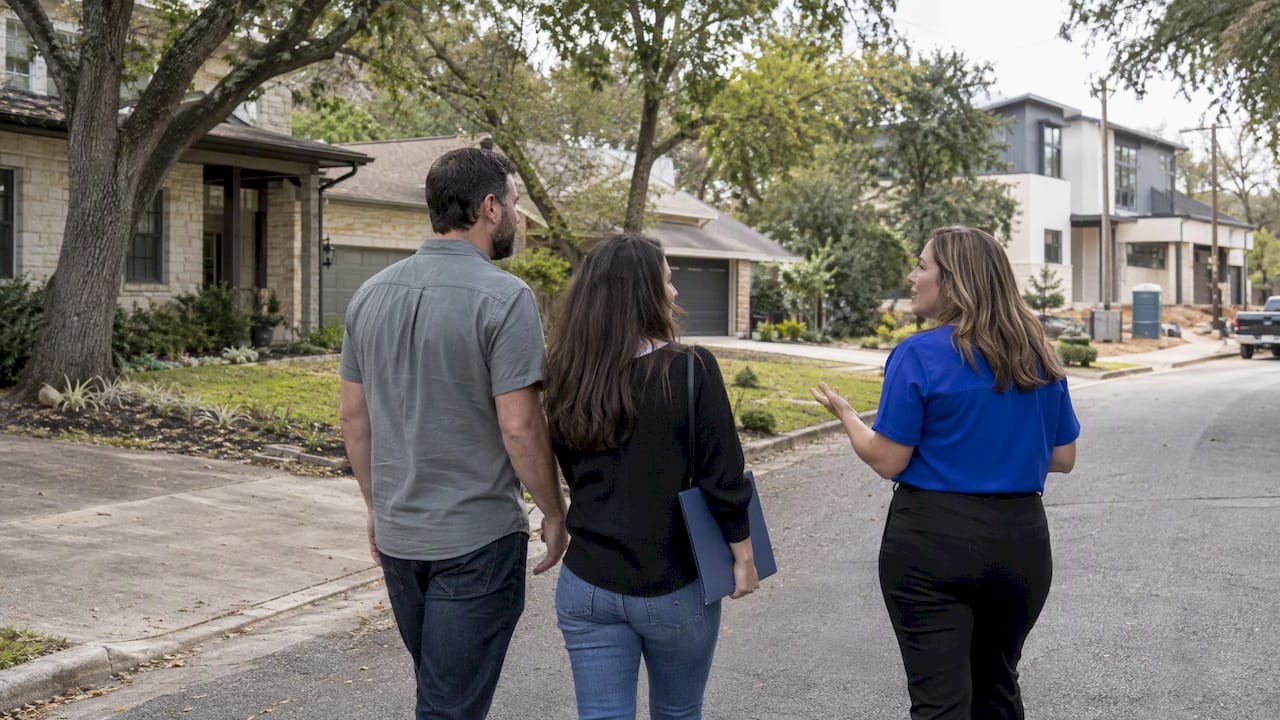
The Austin housing market has cooled from its pandemic peak and is settling into a steadier rhythm. Typical home values sit well below their 2022 highs while inventory has climbed to roughly 4.5 months of supply, giving buyers more leverage than they have had in years. For sellers, that means pricing discipline matters more than optimism.
TL;DR:
- The housing market has shifted to a buyer-favorable position with around 4.5 months of supply, leading to longer sales timelines and more price cuts.
- Mortgage rates remain the key factor affecting affordability, outweighing minor price declines and influencing who can buy based on monthly payments.
- Neighborhood disparities are significant, with entry-level suburbs experiencing faster sales and more competition, while luxury areas see slower turnover and larger discounts.
- Current market stabilization means buyers should focus on monthly payment affordability and sellers should price based on recent comps rather than peak prices.
- Steady population growth, a resilient local economy, and increased new construction in suburbs support long-term demand despite recent correction.
Table of Contents
- Current Snapshot: What the Numbers Say Right Now
- Why the Market Shifted: Rates, Supply, and Migration
- How Price and Pace Vary by Austin Neighborhood
- What Buyers, Sellers, and Investors Should Do Now
- What to Watch Over the Next 6 to 12 Months
- How We Read the Data on the Ground
- Rental Market Indicators: Rents and Price-to-Rent Trends
- A Brief History of What Shaped Today’s Austin Market
- Population Growth and Migration Patterns Shaping Demand
- The Local Economy: Jobs and Income Behind Housing Demand
- Zoning, Regulation, and the Push for More Housing Supply
- New Construction and What’s in the Development Pipeline
- Remote Work and Tech’s Lasting Mark on Housing Demand
- What the Data Actually Tells Austin Buyers and Sellers
- Get a Local Market Consultation From ATXCasa
- FAQ
- Sources
Current Snapshot: What the Numbers Say Right Now
Austin’s market data tells a story of stabilization rather than recovery or decline. We rely on a few distinct metrics, and understanding the difference between them helps explain why headlines sometimes seem to contradict each other.
Zillow’s typical home value (ZHVI) measures the value of a mid-tier home across the metro and smooths out seasonal swings, while the median sale price reflects what actually closed that month, which can shift with the mix of homes sold. MLS-derived reporting tends to track closer to median sale price, and local news outlets often cite that figure when discussing month-to-month pace.
Austin gave back roughly 15% of its pandemic-era price gains according to Case-Shiller data cited in regional economic analysis, a correction that has largely played out rather than one still accelerating.
Here is what the current data points show:
- Months of supply has risen toward the 4 to 5 month range, a level that favors buyers over sellers.
- Days to pending have lengthened compared to the frantic pace of 2021 and 2022.
- A rising share of active listings carry at least one price cut before going under contract.
- Price trends have flattened on a trailing 12-month basis after several years of sharp moves in both directions.
We treat these figures as a snapshot, not a forecast. Local conditions change month to month, and a single metric rarely tells the whole story.
Why the Market Shifted: Rates, Supply, and Migration
Austin’s housing story since 2022 is really a story about affordability. The pandemic brought a surge of remote workers and tech transplants who bid prices well above pre-2020 norms, and when mortgage rates climbed sharply, that same buyer pool largely priced itself out.
In his September 23, 2026 Federal Reserve Board speech, Governor Michael S. Barr said the Atlanta Fed Home Ownership Affordability Monitor fell to 68 in July 2026, its lowest reading in 21 years. He identified high home prices and mortgage rates as barriers to homeownership and discussed housing supply constraints. These findings provide national context, not an Austin affordability measure.
A few forces are shaping where things go next:
- Mortgage rates remain the single biggest lever on monthly affordability, more so than modest price movement.
- Inventory has recovered meaningfully since 2022 as new construction caught up with demand.
- Net migration into the metro has slowed from its pandemic-era peak but has not reversed.
- Luxury listings are moving slower and seeing deeper price cuts than entry-level homes, which still attract competitive offers in the right pockets.
Pro Tip: Ask any lender to run your payment at both the current rate and a rate half a point higher. If the higher payment still works for your budget, you have real room to negotiate on price.
How Price and Pace Vary by Austin Neighborhood
Citywide averages flatten real differences between neighborhoods, and that gap matters more in 2026 than it did a few years ago. Entry-level buyers tend to find the most competition in new-construction suburbs like Leander, Hutto, and parts of Pflugerville, where builders have concentrated affordable inventory and incentives.
Mid-tier neighborhoods such as Round Rock and Cedar Park show a more balanced market, with reasonable days on market and moderate negotiating room. Upper-tier areas inside Austin proper, including parts of Northwest Hills and the 78745 zip code, see slower turnover. Luxury listings in Westlake and Barton Creek face the longest days on market and the deepest price concessions.
- Entry tier: competitive, concentrated in new-build suburbs, fastest pace.
- Mid tier: balanced, moderate days on market, room to negotiate modestly.
- Upper and luxury tiers: slower pace, larger price cuts, buyers hold more leverage.
Whatever tier you’re in, pull comps from your specific neighborhood rather than leaning on a citywide figure.
What Buyers, Sellers, and Investors Should Do Now
The data points to different playbooks depending on where you sit in a transaction.
- Buyers should run affordability checks based on monthly payment, not list price, and keep inspection and financing contingencies given the slower pace working in their favor.
- Sellers should price to current comps, not 2021 or 2022 peaks, since overpricing in today’s market often means a longer time on market and a steeper price cut later.
- Investors should weigh rent-to-price ratios against appreciation expectations, since cash flow now matters more than betting on quick equity gains.
- Everyone should bring a lender preapproval, recent comps for the target neighborhood, and a realistic timeline to any consultation.
Before shopping for a mortgage, it helps to know your real budget. A tool like HomePilot’s affordability calculator compares live rates across dozens of lenders, which can sharpen your number before you start touring homes.
Pro Tip: If a listing has already had one price cut, that is often a signal the seller is ready to negotiate further rather than hold firm.
What to Watch Over the Next 6 to 12 Months
Our baseline expectation is continued stabilization: modest price growth, inventory holding in a buyer-friendly range, and pace staying roughly where it is now, assuming mortgage rates hold steady or ease slightly.
A meaningful drop in rates or renewed tech hiring could tighten the market faster than expected. On the downside, a jump in rates or a continued wave of new listings could soften prices further in some submarkets, particularly at the upper end.
Keep an eye on:
- Monthly inventory and new listing counts.
- Mortgage rate trends and Fed commentary on affordability.
- Local tech-sector hiring announcements.
- Days to pending and price-cut frequency for your target neighborhood.
How We Read the Data on the Ground
We built our approach around combining national indicators with neighborhood-level detail, because a Fed speech on affordability and a FRED price index tell you the climate, not the forecast for a specific street. Our monthly recaps pair ZHVI trends with MLS comps and current supply by zip code before we advise on pricing or offer strategy.
In practice, that has meant advising a seller in a slower upper-tier pocket to price slightly under recent comps to generate competing offers quickly, rather than testing the market with an ambitious number and risking a stale listing. For a buyer competing in a tighter entry-level suburb, that has meant moving fast on inspection timelines while still keeping a financing contingency, since rate volatility remains the bigger risk in 2026.
— Vladimir
Rental Market Indicators: Rents and Price-to-Rent Trends
Rent levels across Austin have leveled off after the sharp run-up earlier in the decade, tracking closer to the broader metro’s slower population growth. For renters and investors alike, that stabilization is a meaningful shift from the double-digit annual rent increases seen a few years ago.
The price-to-rent ratio, which compares typical home values to annual rent, helps investors judge whether buying or renting makes more financial sense in a given neighborhood. When that ratio runs high, renting tends to pencil out better; when it runs low, buying looks more attractive relative to monthly rent costs.
For investors evaluating Austin rentals in 2026, the math increasingly favors neighborhoods with steady renter demand near employment centers rather than purely speculative bets on appreciation. Suburbs with strong job access but lower purchase prices, including parts of Round Rock and Pflugerville, tend to offer a more favorable balance between rent income and acquisition cost than premium central neighborhoods.
Insurance and tax costs eat into rental math more than they did a few years ago, so investors should factor those line items into any cap-rate calculation rather than relying on purchase price and rent alone.
A Brief History of What Shaped Today’s Austin Market
Austin’s housing market did not become expensive overnight. Steady population growth and a strong local economy had been pushing prices upward for more than a decade before the pandemic accelerated everything.
The All-Transactions House Price Index for the Austin-Round Rock-Georgetown metro, produced by the U.S. Federal Housing Finance Agency and available through FRED, is a quarterly index estimated from sales prices and appraisal data for the metropolitan statistical area. It is not seasonally adjusted, and its base is Q1 1995 = 100. The reading was 506.31 in Q2 2026, compared with 501.68 in Q1 2026 and 504.61 in Q2 2025. These metro-wide observations are subject to revision; they do not establish a particular neighborhood’s value or sales pace.
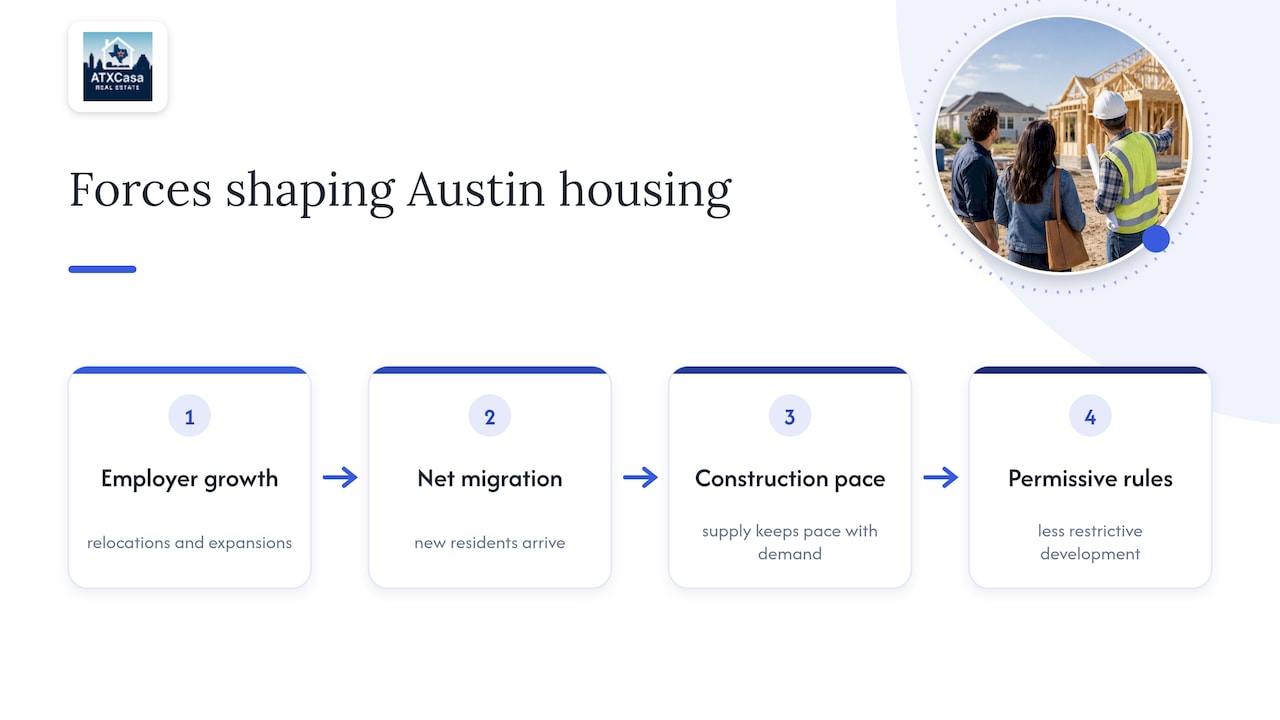
Several forces built that trend over time: major employers relocating or expanding in the metro, a steady flow of new residents drawn by job opportunities and lower costs relative to coastal cities, and a construction industry that has generally kept pace with demand better than many peer metros. Austin’s relatively permissive development patterns compared to older coastal cities have also allowed supply to respond more readily to demand than in more restrictive markets.
Understanding that history helps explain why Austin’s current correction looks different from markets that are structurally oversupplied or facing demand collapse. The fundamentals that drove growth, such as job creation and relative affordability compared to the coasts, remain largely intact even as the pace of price appreciation has slowed.
Population Growth and Migration Patterns Shaping Demand
Austin’s population growth has been a defining feature of its housing market for more than a decade, and that growth has not reversed even as price appreciation has cooled. Net migration into the metro continues, though at a more measured pace than the surge seen during the pandemic years.
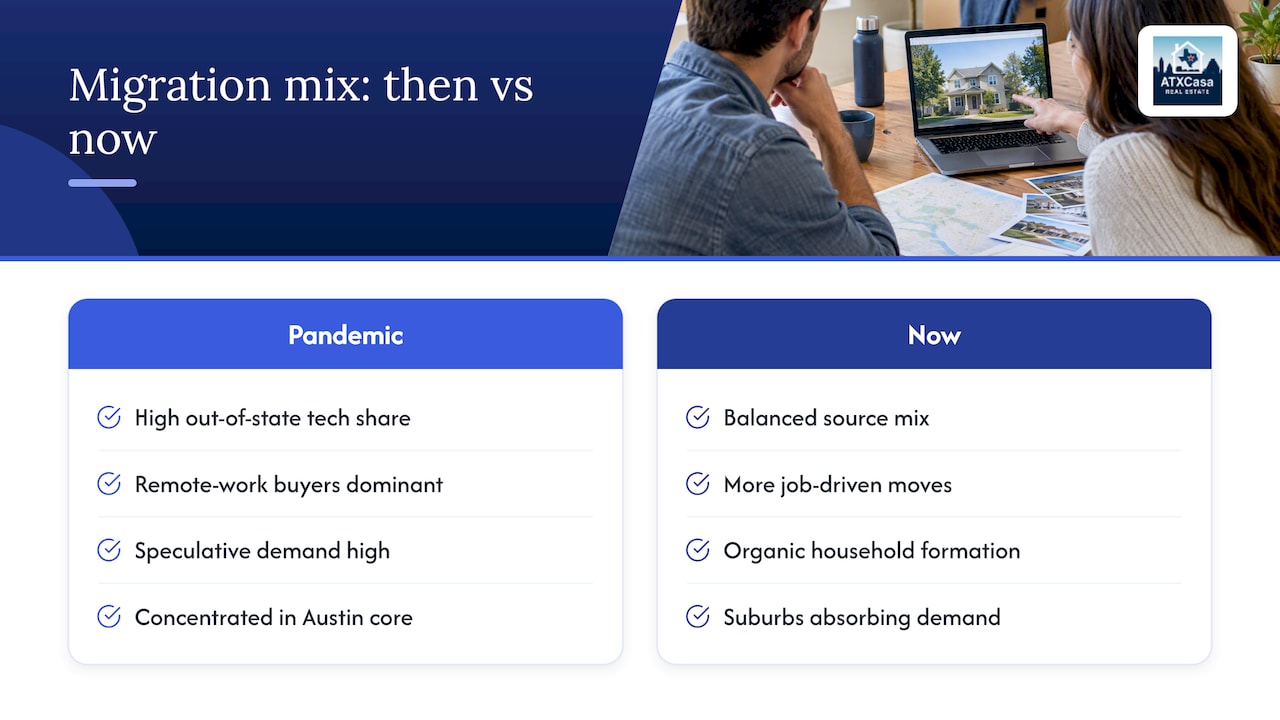
That migration mix matters as much as the raw numbers. Earlier waves brought a large share of remote tech workers and out-of-state buyers with significant purchasing power, which helped push prices sharply higher. The current wave looks more balanced, with a mix of job-driven relocations and organic household growth from existing residents forming new households.
For housing demand, steady population growth means a durable floor under the market even as speculative activity has faded. It also means demand is spreading outward, with suburbs like Georgetown, Hutto, and Leander absorbing a larger share of new households than they did a few years ago, partly because entry-level inventory is more available there than in Austin proper.
Domestic migration from higher-cost states remains a factor, though it is no longer the dominant driver it was during the pandemic’s peak years. International migration and organic population growth within Texas have taken on a larger relative role, which tends to produce steadier, less volatile demand than a market driven primarily by out-of-state transplants chasing remote work flexibility.
The Local Economy: Jobs and Income Behind Housing Demand
Housing demand ultimately follows jobs and income, and Austin’s labor market remains a core part of the story even as hiring has slowed from its pandemic-era pace. The metro’s economy still leans heavily on technology, education, and government employment, with a growing presence in semiconductor manufacturing and clean energy adding diversity to the job base.
Income growth across the metro has moderated after several years of rapid gains tied to high-paying tech relocations. That moderation matters directly for affordability: when local income growth slows while home prices remain elevated relative to pre-pandemic levels, the math for first-time buyers gets tighter even in a market with more available inventory.
Governor Barr’s remarks on national affordability point to mortgage payments, not prices alone, as the binding constraint for most buyers, and that applies with particular force in a high-income, high-cost metro like Austin. A household earning a solid local salary can still find monthly payments stretching their budget if rates stay elevated.
For buyers evaluating their own position, local income relative to the metro’s typical home value is a more useful yardstick than comparing Austin to national averages, since the mix of industries and pay scales here differs meaningfully from most other large metros.
Zoning, Regulation, and the Push for More Housing Supply
Local zoning and regulatory decisions have played a direct role in how quickly Austin’s housing supply has been able to respond to demand. Compared to many older coastal cities, Austin’s land-use rules have historically allowed somewhat more flexibility for new development, which helped supply catch up after the pandemic-era price spike.
That said, debates over density, minimum lot sizes, and permitting timelines remain active locally, and the outcome of those debates shapes how much new inventory reaches the market in coming years. Faster permitting and more flexible zoning near employment centers tend to ease upward price pressure over time, while restrictive rules in high-demand neighborhoods concentrate price growth in the areas that remain hardest to build in.
For buyers and investors, zoning matters beyond the political debate: it affects which neighborhoods are likely to see new supply, and therefore which areas are more likely to see price growth moderate versus accelerate. Areas with active rezoning discussions or recent approvals for higher-density development are worth watching closely, since added supply there can shift the local balance between buyers and sellers within a few years.
New Construction and What’s in the Development Pipeline
New construction has been a major release valve for Austin’s affordability pressure, concentrated heavily in suburbs ringing the core metro. Builders have leaned into entry-level and mid-tier product in areas like Leander, Hutto, Manor, and parts of Georgetown, where land costs remain lower than inside Austin’s city limits.
That pipeline has materially boosted the inventory figures discussed earlier in this article, and it is part of why months of supply has climbed toward more balanced territory. Builders in these suburbs have also leaned on incentives such as rate buydowns and closing cost credits to keep move-in-ready inventory competitive against resale homes.
Inside the city core, new construction skews more toward infill and higher-density product, reflecting both land scarcity and recent zoning conversations around density near transit and employment corridors. That split, abundant new supply in the suburbs and more constrained, higher-cost infill in the core, is a major reason neighborhood-level price trends diverge so much from the metro average.
For buyers prioritizing affordability, new-construction suburbs remain the most reliable source of competitively priced inventory in 2026. For those prioritizing proximity to central Austin employment and amenities, new supply is more limited and commands a real price premium.
Remote Work and Tech’s Lasting Mark on Housing Demand
Austin’s tech presence remains central to its housing story, even though the dynamic has shifted since the height of the pandemic. The initial remote-work wave pulled in buyers with high incomes and few ties to a specific office location, and that demand pushed prices sharply upward across the metro.
As more employers have shifted toward hybrid or in-office expectations, some of that location-agnostic demand has faded, which helps explain part of the market’s cooling from its peak. At the same time, major employers maintaining and expanding physical operations in the metro continue to anchor housing demand in neighborhoods near those campuses.
The net effect in 2026 is a more grounded version of the tech-driven demand that reshaped Austin earlier in the decade. Remote flexibility still matters to some buyers, particularly those relocating from higher-cost coastal metros, but local job anchors now play a larger relative role in where demand concentrates than they did when remote work was at its peak. That shift favors neighborhoods with strong commute access to major employment centers over purely lifestyle-driven location choices.
What the Data Actually Tells Austin Buyers and Sellers
The conventional read on Austin right now treats the market as either in freefall or fully recovered, and both framings miss what the data actually shows. This is a market finding a new equilibrium after an unsustainable spike, not a market in crisis and not one returning to 2021-style bidding wars.
What gets underrated is how much neighborhood-level variation matters more than the metro headline. A buyer fixated on a citywide median price can misjudge both opportunity and risk, missing competitive entry-level suburbs while overpaying attention to slow-moving luxury segments that don’t reflect their situation at all.
What we’d prioritize differently: focus less on predicting where rates go and more on what a given payment means for your specific budget today, since that number is knowable now and rate predictions are not. Pair that with hazard data, since property-level flood and climate risk varies block by block in ways a median price never captures, and that risk affects insurance costs and long-term value regardless of which way rates move.
— Vladimir
Get a Local Market Consultation From ATXCasa
Our process combines real-time Austin data with neighborhood-level detail a national report can’t give you. Whether buying, selling, or evaluating an investment, current comps, inventory trends, and pricing strategy specific to your target area are reviewed before recommendations.
A consultation with us typically covers:
- A pricing or offer strategy based on current comps for your specific neighborhood, not citywide averages.
- A realistic timeline based on current days-to-pending data for your price tier.
- Guidance on financing options, contingencies, and negotiation leverage given current market conditions.
Ready to talk through your specific situation? Reach out through ATXCasa to schedule a consultation.
FAQ
Is Austin’s housing market dropping?
Austin’s market has corrected from its pandemic-era peak rather than continuing to drop sharply, with regional analysis showing the metro gave back roughly 15% of its pandemic gains before stabilizing. Current data points to a more balanced market with modest price movement rather than an ongoing decline.
Why are people moving out of Austin?
Some residents have left for lower-cost metros as affordability pressure, driven largely by mortgage rates rather than runaway prices, has made monthly payments harder to manage. That said, net migration into the metro has continued, just at a slower pace than during the pandemic’s peak years.
Is it a good time to buy a house in Austin, TX?
Conditions favor buyers more than they have in recent years, with inventory sitting around 4.5 months of supply and more room to negotiate on price and terms. Whether it’s the right time depends heavily on your specific budget and target neighborhood, since conditions vary significantly by price tier.
Is $100,000 a good salary in Austin?
A comfortable standard of living in Austin relative to many other major metros depends heavily on mortgage rates and the specific neighborhood you’re targeting. Given that national affordability pressure is driven primarily by monthly payment constraints rather than price alone, it’s worth running your own payment math before assuming a given salary stretches as far as it would have a few years ago.
Sources
- Speech: The Costs of Shelter Today | Michael S. Barr | Federal Reserve Board
- All-Transactions House Price Index for Austin-Round Rock-Georgetown, TX (ATNHPIUS12420Q) | FRED
- First Street Foundation – Austin, TX flood risk