
The Austin–Round Rock metro median listing price was $228 per square foot in September 2026, down from $231 in August. That is a metro-wide listing figure. The number for a specific Austin home can sit far above or below it, depending on location, lot, age and size. Below, I explain how the figure is calculated, why different websites publish different values, and how to use it when you buy, sell or invest.
TL;DR
- The metro median listing price per square foot was $228 in September 2026, according to the Realtor.com series published on FRED.
- The measure has fallen for several months in a row, which fits a market where buyers have more room to negotiate.
- Listing-based and sold-based figures answer different questions. Compare like with like before you draw a conclusion.
- Location drives the spread more than any other factor. Use comparable sales within the same area, size range and age, not a metro average.
Table of Contents
- What the Austin price per square foot figure means
- Where Austin stands now
- Listing price versus sold price
- Why price per square foot varies so much across Austin
- How to use price per square foot in practice
- A quick checklist before you trust any per-foot figure
- Our perspective
- Work with us on your numbers
- FAQ
- Sources
What the Austin price per square foot figure means
Price per square foot is a home’s price divided by its living area. FRED defines its Realtor.com series as the median listing price per square foot in the market during that month. Half of the active listings are priced above the median and half below.
A simple example shows how to read it. If a 2,000-square-foot home is priced at $456,000, the figure is $228 per square foot. That is an illustration of the arithmetic, not a price I am quoting for any real home.
Three details matter when you compare numbers:
- Which price is used. Listing (asking) prices and closed sale prices are different datasets.
- Which area is covered. The City of Austin, the Austin–Round Rock metro and a single ZIP code give different answers.
- Which square footage is used. Appraisal district records, builder plans and agent-entered figures can differ, especially for additions, garages and finished attics.
That is why you will see Austin numbers ranging from roughly the low $200s to well above $300 in a quick search. Most of the time the sources are not wrong. They measure different things.
Where Austin stands now
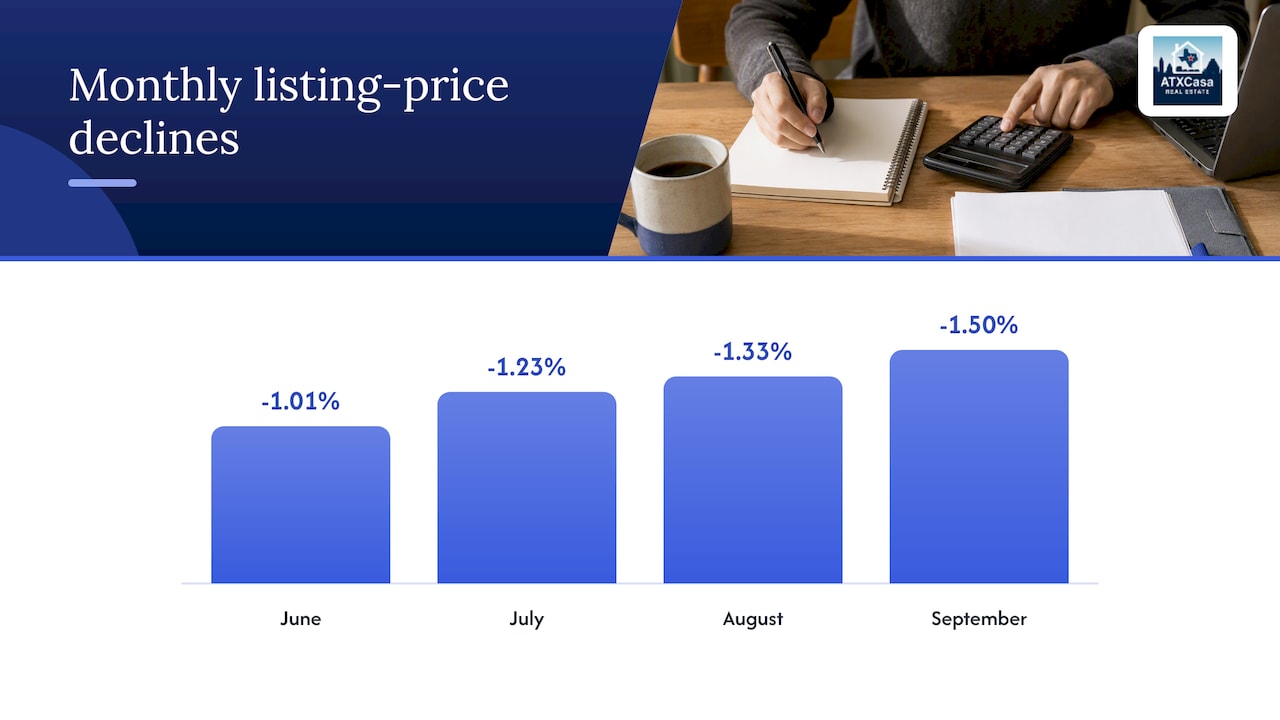
The Realtor.com series published on FRED puts the Austin–Round Rock metro at $228 per square foot for September 2026. Its separate monthly percentage-change series, which is not seasonally adjusted, reports a 1.50% month-over-month decline in September, after declines of 1.33% in August, 1.23% in July and 1.01% in June. The September change of -1.50% is the value reported in that separate series; it should not be recalculated from the rounded whole-dollar levels shown in the table below.
A third-party tracker that charts the same area shows a similar level: $234 per square foot in July 2026. The two readings are close, and the difference reflects the month and the method.
| Measure | Figure | Period |
|---|---|---|
| Metro median listing price per sq ft | $228 | September 2026 |
| Metro median listing price per sq ft | $231 | August 2026 |
| Metro monthly change in the measure | -1.50% | September 2026 |
A steady monthly slide is the pattern worth noticing. Over four consecutive months the measure moved down by about one to one and a half percent each month. It tells you that asking prices, once adjusted for size, have been softening. It does not tell you what any one house will sell for.
For the wider picture on supply and pricing, our pages on Austin home prices in 2026 and the Austin housing market track the same trend with local detail.
Listing price versus sold price
An asking price is a seller’s opening position. A sold price is what a buyer agreed to pay after inspections, repairs and negotiation. When you evaluate a home, the second number is the one that counts.
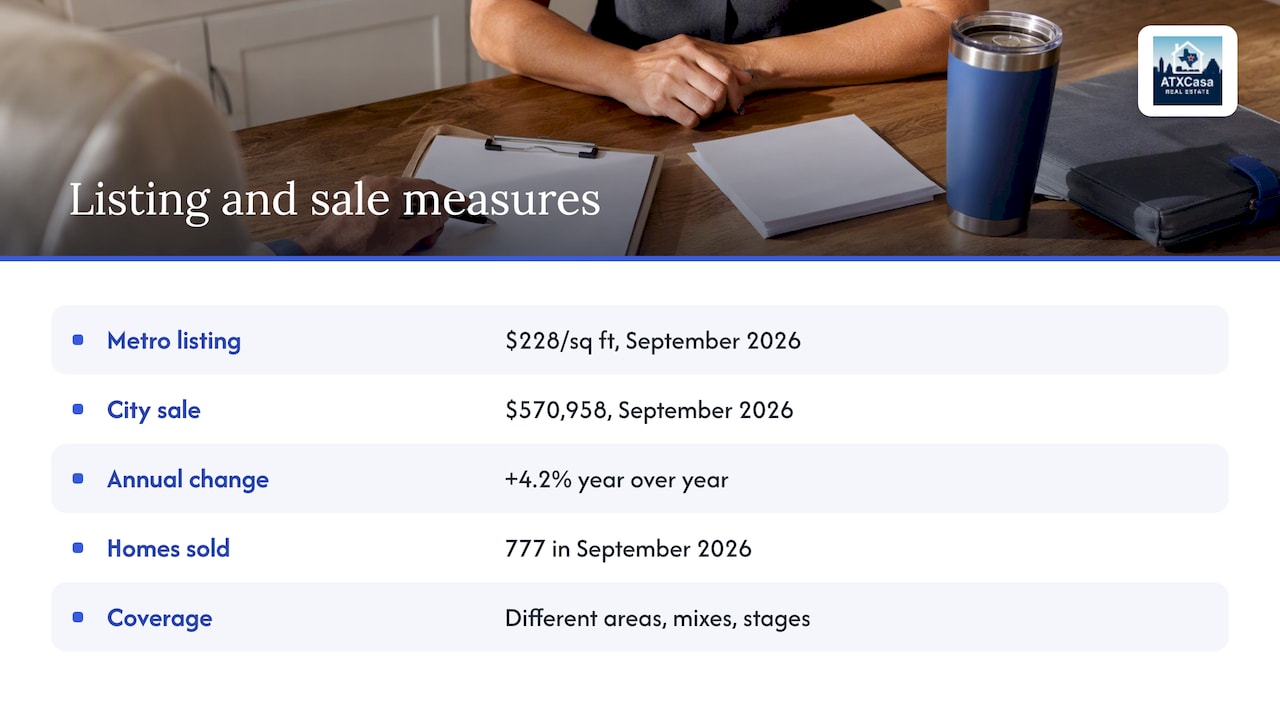
Unlock MLS reported that in September 2026 the City of Austin’s median residential sale price was $570,958, up 4.2% year over year, with 777 homes sold. Unlock MLS labels the city measure as the median price for residential homes sold. It is a total sale price, not a per-square-foot figure, so it is not directly comparable with the $228 metro listing number. The two cover different areas, different mixes of homes and different stages of the transaction.
There is also a useful signal when the two datasets move apart. One market analysis suggests that when higher asking prices meet weaker closed-price confirmation, sellers are testing the market harder than buyers are willing to validate. In practice, I read it as a prompt to check how far recent sales landed from their list prices before I trust a listing’s per-foot figure.
If you want to see how close-to-list behavior varies by area, our guide to what sold homes reveal about Austin neighborhood prices is a good next read.
Why price per square foot varies so much across Austin
Two homes with identical floor area can differ by hundreds of thousands of dollars. The main reasons:
Distance from downtown and land value
In its 2019–2021 analysis of typical-home submarkets, the Texas Real Estate Research Center found this pattern: Austin-area land prices generally fall as distance from downtown rises. In that analysis, similar houses closer to Austin’s center were priced higher than those farther out. This historical finding helps explain why land value matters when comparing homes, but it does not establish current price-per-square-foot levels for a particular neighborhood or suburb.
Home size
Price per foot usually falls as homes get larger. The first 1,200 square feet of a house include a kitchen, bathrooms and mechanical systems that cost about the same whether the home is small or large. Additional rooms are cheaper to add. So a compact 1,100-square-foot condo can show a higher per-foot figure than a 3,200-square-foot house at a lower total price. Comparing them directly misleads.
Age, type and construction
Newer, smaller-footprint housing often performs differently from traditional large single-family homes. Austin’s HOME initiative is one example. Data from 2025 shows HOME units selling at a median discount of 6.1%, compared with 10.6% for traditional new construction. That is about discounts to list, but it shows that product type changes how a price behaves.
Lot, condition and finishes
Per-foot figures ignore lot size, pool, view, flood or foundation history, and interior quality. A renovated 2,000-square-foot home and a dated one on the same street can differ by 20% or more for reasons the measure cannot see. For outdoor features, see how patio improvements affect resale return before you assume that a yard upgrade belongs in the price.
How to use price per square foot in practice
If you are buying
- Build a tight comparison set. Pick sold homes from the last three to six months, in the same neighborhood or subdivision, within about 15% of the size and the same age band.
- Calculate each sold price per foot. Use closed prices, not asking prices.
- Compare the listing to your set. If it is well above the range, ask what justifies it: renovation, lot, location on the street.
- Use supply as leverage. As of May 31, 2026, the Austin metro had 5.4 months of supply, down 3% year over year, and buyers could press for price, credits or terms on stale or reduced listings. Our explainer on what 4.5 months of inventory means shows how to translate supply into negotiating room, and our current inventory update has the latest reading.
If you are selling
The per-foot figure helps you test a price, but it should not set it. Start from recent sold comparables, then adjust for condition, upgrades and lot. If your home has a smaller footprint than most nearby sales, expect a higher per-foot number and a lower total price. If it is larger, the reverse. Our walkthrough on using Austin sold-home data to price your home covers the method step by step.
Overpricing in a market where the measure has been falling is costly. A listing that sits builds a reduction history, and later buyers will use it against you.
If you are investing
Investors use the figure for two checks. The first is acquisition cost against comparable sales. The second is whether the home’s price per foot makes sense against its rent per foot. Pairing both shows whether a purchase can carry its cost. To anchor the rent side, a free rent estimate and rental comps calculator gives you a starting range to compare with your purchase price. Confirm any estimate against actual leased comparables before you commit.
For new builds and investment angles, see our section on new construction and investment. One caution on new builds: a high affordability grade for the market does not equal affordability for your budget, as we explain in why an A− housing grade is not personal affordability.
A quick checklist before you trust any per-foot figure
- Is it based on listings or closed sales?
- Does it cover the city, the metro or a ZIP code?
- What month does it describe, and is it a median or an average? Averages get pulled up by a few luxury sales.
- How was square footage measured, and does it match the county record?
- Do the homes in the sample resemble yours in size, age and lot?
If you cannot answer these, treat the figure as context, not evidence.
Our perspective
Most of the questions we get about price per square foot are really questions about whether a price is fair. The number is a good first filter and a poor final answer.
We came to real estate from a long career in IT, so we like data, and that is also why we are careful with it. A metro figure like $228 hides the difference between a downtown condo and a Georgetown family home. A listing figure hides what buyers actually agreed to pay. We would rather show you the sold comparables for your street and your size range, side by side, than hand you one number.
Our approach is to combine locally sourced, current market data with a plain explanation of what it means for your decision: where a seller is likely to move on price, which listings have a history, and what hidden issues a spreadsheet cannot show. That is the kind of guidance we built ATXCasa around, and it is what we bring to each client in Cedar Park, Round Rock, Georgetown and Austin itself.
Vladimir
Work with us on your numbers
If you are weighing a purchase, a sale or an investment in the Austin area, we can build the sold-comparable set for your target neighborhood and home size, and show you where the price per square foot sits against it.

Start on ATXCasa to talk through your plan, or browse our guides on Austin neighborhoods and lifestyle first. For context on negotiating in this market, read whether it is easier to buy a home in Austin in 2026.
FAQ
What is the average price per square foot in Austin?
For the Austin–Round Rock metro, the median listing price was $228 per square foot in September 2026, according to the Realtor.com series on FRED. City-only and sold-price figures differ, and so do figures for individual ZIP codes, so check which area and which measure a source uses.
Are Austin home prices still falling?
The metro’s listing price per square foot declined in each month from June through September 2026, with a 1.50% drop in September. Meanwhile, the City of Austin’s median sale price was up 4.2% year over year in September, so the two measures do not tell an identical story. Looking at both gives a fairer view.
Is price per square foot the best way to value a home?
It is a useful screening tool, not a valuation. It works best when you compare homes of similar size, age and location, using closed sales. Lot, condition, upgrades and flood or foundation history all affect value and do not appear in the figure.
How much does it cost to build a 3,000-square-foot house in Austin?
Costs depend on the builder, finishes, lot and permitting, and they change with materials and labor. We would not quote a single number. Get itemized bids from licensed builders for your specific plans, and compare them against the price per foot of comparable new homes in the area you want.
Sources
- FRED: Median Listing Price per Square Feet in Austin–Round Rock, TX
- FRED: Monthly change in median listing price per square foot, Austin–Round Rock
- Macrotrends: Austin Area Home Prices per Square Foot
- Unlock MLS: September 2026 Central Texas Housing Report
- Texas Real Estate Research Center: What’s Driving Austin Home Price Appreciation?
- Austin Board of Realtors: HOME Outcomes & Market Performance report
- HomeAcquire: Austin, TX Metro Housing Market