

TL;DR
- A price-cut share tells you how common asking-price reductions were among active listings. It does not tell you how large those reductions were.
- A close-to-list average describes completed sales. It cannot predict your home’s sale price or tell you what to ask.
- The reports here cover different places and months: the Austin metro in September 2026 and the City of Austin in August 2026.
- Before changing a listing, compare current competition, condition, list-price history, buyer/showing feedback, and applicable recent comparable sales.
If you’re selling an Austin-area home, a headline about price cuts can make an asking-price change feel urgent. A close-to-list percentage may seem to supply the amount. But these figures answer different questions. Use them as dated context; change your strategy only when the evidence for your own home supports it. That can mean adjusting price, addressing a specific problem, or holding steady while monitoring comparable competition.
What each Austin statistic actually measures
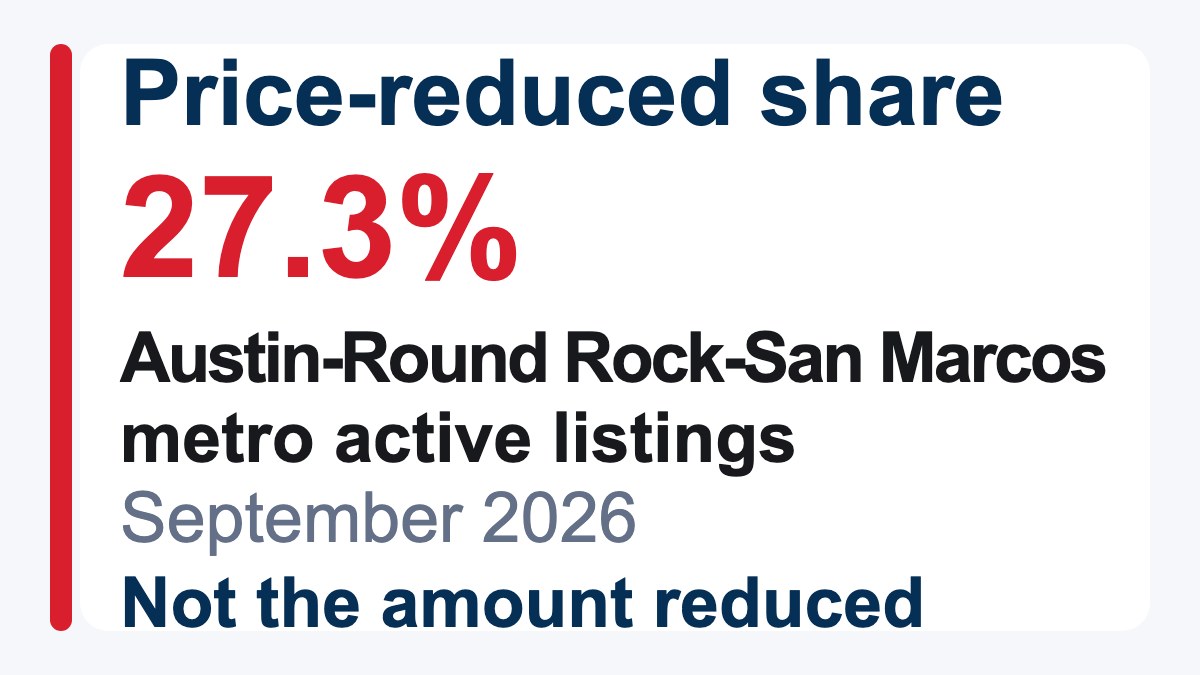
Realtor.com’s September 2026 report gives Austin-Round Rock-San Marcos a 27.3% price-reduced share. Its methodology describes active listed inventory. This is the share of listings with a price cut, not the percentage taken off their prices. It does not tell you the size, timing, or number of reductions, or what those homes eventually sold for.
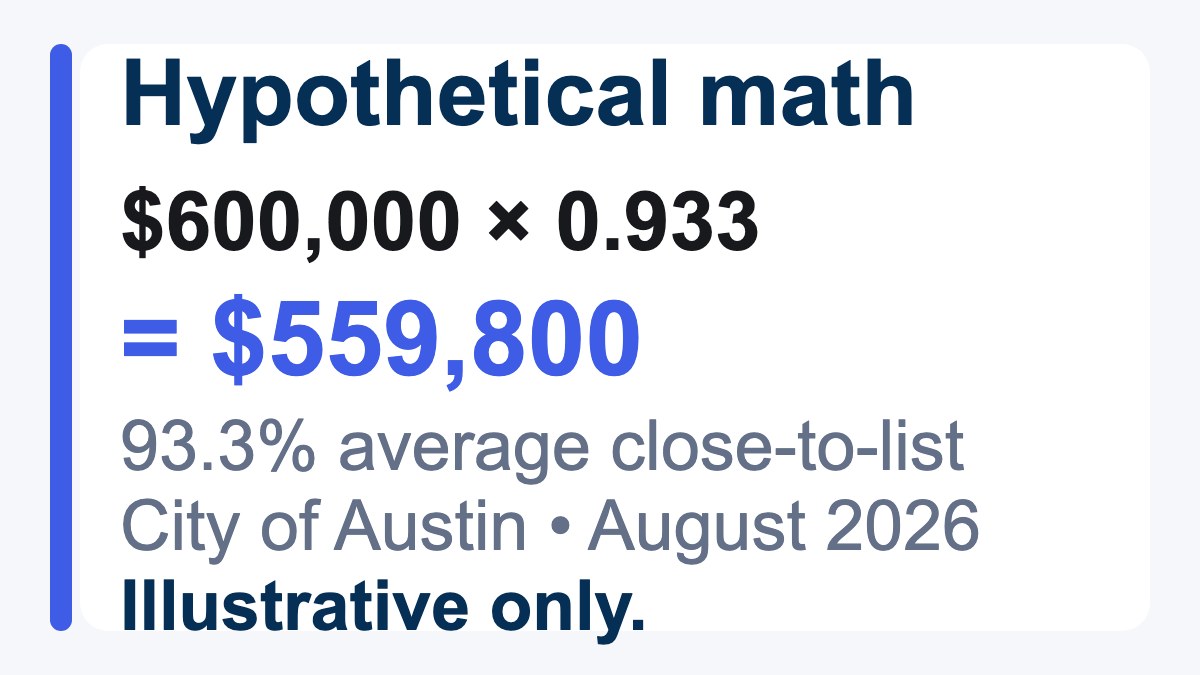
Unlock MLS’s August 2026 report gives City of Austin residential homes sold a 93.3% average close-to-list result. A close-to-list ratio compares a completed sale price with the list price used in the calculation. The reported average does not disclose an individual home’s condition, list-price history, concessions, location, or competing inventory.
| Report | Homes and period covered | Useful question it answers |
|---|---|---|
| Realtor.com: 27.3% | Austin-Round Rock-San Marcos active listings, September 2026 | How common were asking-price reductions in this inventory? |
| Unlock MLS: 93.3% | City of Austin completed residential sales, August 2026 | How did closing prices compare with the list-price benchmark on average? |
These are different geographies, months, and populations. The metro listing statistic is not a City of Austin sales result, and the city sales average is not a metro-wide forecast. You also cannot use these figures to show that homes with reductions later achieved the reported close-to-list average: the reports do not establish that they track the same homes.
A $600,000 example: arithmetic is not a valuation
Suppose your home is listed at a hypothetical $600,000. Multiplying that price by the reported August City of Austin ratio gives $600,000 × 0.933 = $559,800. This illustrates what 93.3% of that hypothetical list price equals. It does not mean your home should be priced at, reduced to, or expected to sell for $559,800.
Now add the September metro figure. Knowing that 27.3% of active listings had a price reduction supplies no missing property details and no reduction amount. Combining the statistics still does not tell you what to do with this $600,000 listing.
Here is what would change the decision. Suppose buyers can choose comparable homes in similar condition at lower asking prices, applicable recent comparable sales support a lower value, and showing feedback repeatedly identifies price as the obstacle. Taken together, those hypothetical facts would support revisiting the asking price. The amount would come from the property comparison, not either headline percentage.
If instead the comparison supports the asking price and feedback identifies poor photos or difficulty arranging a showing, addressing that specific barrier first may be more sensible. That preserves the opportunity to test the supported price, but takes time and does not solve a price mismatch if one also exists. These are illustrative decision rules, not observations about a particular Austin listing.
Decide what to change using your home’s competition
For an Austin-area seller, the useful local comparison is the set of properties a buyer could realistically choose instead. Neither a metro-wide listing share nor a City of Austin sales average establishes the right price for a particular neighborhood or property type.
Before revising an individual listing, compare the home’s current competition, condition, list-price history, buyer/showing feedback, and applicable recent comparable sales. Each input has a job:
- Current competition and condition: Compare similar homes and identify what a buyer gains or gives up at each asking price. A lower-priced home with materially different condition is not automatically evidence that yours needs the same price.
- List-price history: Review where your listing started and what has already changed. A headline about reductions cannot tell you whether an earlier adjustment has addressed the mismatch.
- Buyer/showing feedback: Look for a recurring, specific obstacle. Repeated price objections deserve a different response from difficulty viewing the home; either needs to be checked against the property comparison.
- Applicable recent comparable sales: Use recently sold homes as a starting point, then assess which are relevant to your location, property type, and condition. An asking price expresses a seller’s goal; a completed sale records an outcome.
A supported price reduction can make your home more competitive, but it lowers the amount you ask buyers to pay and does not guarantee an offer. Holding the price can be reasonable when the property comparison supports it and feedback does not show a consistent mismatch. The cost is more time on the market and continued ownership expenses if the home remains unsold.
After a change, check whether showing response and feedback improve and whether competing listings or relevant completed sales change the comparison. If a presentation fix leaves a repeated price objection unresolved, revisit price. If a reduction produces no useful response, reassess the full comparison before reducing again. Neither report supplies a universal waiting period or a required adjustment.
Frequently asked questions
Does “close-to-list” mean the original asking price or the final asking price?
The verified excerpt used here does not establish which list-price benchmark Unlock MLS uses. Keep its label “average close to list price” and do not describe it as a discount from the original asking price. That interpretation requires the publisher’s definition and, for a particular home, its listing history.
Does the Realtor.com price-cut share include new construction?
Realtor.com’s methodology says its inventory includes existing single-family homes and condos, townhomes, row homes, and co-ops, and generally excludes new construction unless MLS-listed. If a builder’s homes are realistic alternatives for your buyer, compare those specific homes and terms separately; do not assume this statistic represents all builder inventory.
Sources
- Unlock MLS: August 2026 Central Texas Housing Report — published September 15, 2026; City of Austin completed residential sales.
- Realtor.com: September 2026 Monthly Housing Trends — dated September 30, 2026; Austin-Round Rock-San Marcos active-listing table and inventory methodology.
Recommended reading
- Austin Housing Inventory: What 4.5 Months Means
- Austin Home Shoppers: An Active-Listings Headline Is Not a Real-Time Availability Count
Deciding whether to change your Austin-area asking price? Contact Vladimir Baibus · ATXCasa, with LPT Realty, to compare your home’s competition, condition, price history, showing feedback, and relevant recent sales before choosing the next step.