

Austin’s median home price is generally reported at several hundred thousand dollars as of early 2026, with values essentially flat compared to a year ago after the sharper corrections of 2023 and 2024. The market has moved from cooling to stabilizing: inventory remains elevated by Austin’s own historical standards, but price declines have slowed. The rest of this report breaks down the numbers, the neighborhood variance, and what we’d actually do if we were in your shoes.
TL;DR:
- Austin area median estimates range from the low $400,000s to the mid $500,000s, so compare rolling averages rather than relying on one month’s figure.
- A $450,000 budget in Round Rock can buy a newer four bedroom home, while central Austin may offer a smaller, older property needing updates.
- A half point rate change shifts monthly payments by about $120 on a $360,000 loan, potentially affecting mortgage qualification even when prices stay steady.
- Compare builder rate buydowns and closing cost credits with resale offers, because incentives can lower monthly payments more than a similar home’s sticker price suggests.
- General residence-homestead eligibility requires an ownership interest and use as your principal residence. Qualified buyers who acquire a home after January 1 may receive the exemption for the applicable part of that year if the previous owner did not receive the same exemption. Applications generally are due before May 1; the local appraisal district decides eligibility.
Table of Contents
- Current Austin market stats: price, inventory, and days on market
- Price trends: where Austin has been and where it’s heading
- Neighborhood and suburb price bands: Austin, Round Rock, Cedar Park, and Georgetown
- What’s driving Austin prices right now: jobs, migration, and construction
- How mortgage rates affect your monthly payment and buying power
- What to do next if you’re buying, selling, or investing in Austin
- How we read the Austin market on the ground in 2026
- Historical home price trends over the past 5 to 10 years
- How Austin home prices compare to other Texas and national metros
- How property taxes and local fees affect affordability
- Where the investment opportunities are across Austin property types
- What these numbers mean if you’re an everyday Austin household
- How ATXCasa can help you navigate Austin’s 2026 market
- FAQ
- Sources
Current Austin market stats: price, inventory, and days on market
Before you set a budget or a list price, you need the baseline numbers. Austin’s housing market in 2026 looks very different from the frenzy of 2021, and the current snapshot reflects a market that has absorbed a lot of inventory and settled into a more balanced rhythm.
Local market reports place the Austin-area median sale price in a range running from the low $400,000s to the mid $500,000s depending on the month and the specific data source, which is why we always recommend comparing rolling averages rather than a single month’s number. That range reflects the mix of central Austin, inner suburbs, and outlying communities all being folded into metro-wide averages, something we unpack further in the neighborhood section below.
Here’s the broader snapshot buyers and sellers are working with right now:
- Employment context: when assessing continued job growth and relatively low unemployment, use dated local observations. BLS reported total nonfarm employment of 1.4159 million in the Austin-Round Rock-San Marcos metro in August 2026, up 1.2% from a year earlier, and an unemployment rate of 3.9%. These August figures are preliminary and not seasonally adjusted. They provide labor-market context but do not by themselves establish housing demand.
- Inventory remains a buyer-friendly factor: more homes are sitting on the market longer than during the 2021 peak, giving buyers room to negotiate.
- Rate-driven payment math still shapes demand: monthly payments at current mortgage rates remain the single biggest factor pricing out marginal buyers.
- New construction continues competing with resale: builders in the suburbs are offering incentives that pull some demand away from existing homes.
BLS reported unemployment rates of 3.4% to 4.1% in the Austin-Round Rock-San Marcos metro from March through August 2026. These figures are not seasonally adjusted; the August rate was 3.9% and preliminary. This defined reporting window does not establish a full-year trend or show how much individual households can afford to spend on housing.
Price trends: where Austin has been and where it’s heading
Austin’s price trajectory over the last few years tells a story of correction followed by stabilization, not a continued slide. Understanding the shape of that curve helps explain why today’s asking prices look the way they do.
The sharpest declines came after the 2021 to 2022 peak, when pandemic-era migration and historically low rates pushed Austin prices to levels that proved unsustainable once mortgage rates climbed. Local market reports show the median price pulling back meaningfully from that peak before finding a floor. Since then, month-to-month movement has been modest, with neither sharp drops nor a rebound rally defining recent data.
A few patterns stand out when you look at the last several months:
- Year-over-year change has flattened: prices are close to where they were a year earlier, rather than trending sharply in either direction.
- Momentum has shifted from decline to stabilization: the free-fall phase of 2022 to 2023 has given way to a market that moves in small increments.
- Rate sensitivity remains the dominant short-term driver: any meaningful move in mortgage rates tends to show up in buyer activity within weeks.
- Inventory absorption is gradual: homes are selling, but the pace keeps supply from tightening quickly.
What ties this together is the relationship between rates, demand, and the number of homes for sale. When rates eased slightly earlier in 2026, we saw buyer inquiries pick up, but inventory levels were high enough that it didn’t translate into bidding wars. That combination, enough supply to absorb demand spikes without pushing prices sharply higher, is the defining feature of the current trend. Our own monthly market recaps track this pattern county by county, and the pattern has held fairly consistently across Travis and Williamson counties.
Barring a significant rate move in either direction, we expect the next several months to look similar: small variations around a stable median rather than a decisive breakout.
Neighborhood and suburb price bands: Austin, Round Rock, Cedar Park, and Georgetown
Metro-wide medians hide a lot of variation, and Austin is a city where the difference between one zip code and the next can be substantial. If you’re shopping by budget rather than by map, these bands give you a starting point.
- Entry-level range (roughly under $400,000): this tier is largely concentrated in outer suburbs and parts of Round Rock and Georgetown, where townhomes and smaller single-family homes dominate.
- Mid-range (roughly $400,000 to $600,000): the bulk of Cedar Park, much of Round Rock, and many Georgetown communities fall here, typically offering three- to four-bedroom homes with moderate lot sizes.
- Upper-mid and premium range (roughly $600,000 and above): central Austin neighborhoods, lakefront and hill-country adjacent properties, and newer premium developments in Georgetown’s master-planned communities sit at this level.
- Luxury and custom range: scattered pockets of central Austin and parts of the hill country command prices well above the metro median, often tied to lot size, views, or historic character rather than square footage alone.
What you get at each band shifts quickly. A $450,000 budget in Round Rock might buy a newer four-bedroom home with a two-car garage, while the same budget in central Austin is more likely to land a smaller, older home needing updates. Georgetown’s communities range widely too, from established neighborhoods near the historic square to newer master-planned subdivisions with resort-style amenities, so the price band alone doesn’t tell the whole story.
Micro-markets can also shift rank within a single year. A neighborhood that looked like a bargain eighteen months ago can move up a price tier once a new school rating, retail development, or highway expansion changes its appeal. We walk through specific examples of this in our neighborhood sold-price analysis, which tracks how sold prices, not just listing prices, have moved across different pockets of the metro.
What’s driving Austin prices right now: jobs, migration, and construction
Three forces are doing most of the work behind today’s price levels: the labor market, migration patterns, and the pace of new construction.
For a dated view of local employment, the Austin-Round Rock-San Marcos metro’s broader economic data show total nonfarm employment of 1.4159 million in August 2026, up 1.2% from August 2025, and an August unemployment rate of 3.9%. These figures are not seasonally adjusted, and August estimates are preliminary. Labor data alone do not demonstrate the source or durability of housing demand.
Migration and company expansion remain part of the picture, though the dynamic has changed. The Austin Chamber’s 2026 reporting on local tech companies describes a shift toward scaling talent and nearshore delivery models rather than the rapid headcount growth of 2020 to 2022. That structural shift in how companies grow still generates housing demand, just at a steadier pace than the earlier boom years.
A few additional factors round out the picture:
- New construction has added real competition for resale homes, particularly in Georgetown and Round Rock, where builders can offer incentives resale sellers can’t easily match.
- Permitting activity in the suburbs continues to add inventory faster than in central Austin, which helps keep suburban price growth in check.
- Relocation demand tied to employer expansion remains a steady, if less dramatic, driver than in prior years.
Pro Tip: If you’re comparing a resale home to new construction at a similar price, ask what incentives the builder is offering, rate buydowns and closing cost credits can change your effective payment more than the sticker price suggests.
How mortgage rates affect your monthly payment and buying power
Rates matter more than the median price itself when it comes to what you can actually afford each month. A modest move in rates can change your buying power by tens of thousands of dollars even if the sale price doesn’t move at all.
Here’s a simplified illustration using a representative Austin-area median price.
A half-point swing in mortgage rates on a $360,000 loan changes the monthly payment by roughly $120, which is often the difference between qualifying for a home and having to adjust your search budget. That kind of swing explains why buyer activity can shift quickly even when the median sale price barely moves, and it’s why sellers in 2026 are finding they sometimes need to offer rate buydowns or closing cost credits to keep a deal together.
If you’re deciding when to lock a rate, the general rule holds: lock once you’re under contract and comfortable with the payment, rather than trying to time a market that moves on factors well outside your control. Buyers weighing a 15-year term should run both scenarios against their monthly budget, since the higher payment buys a significantly faster payoff but reduces flexibility if income changes.
What to do next if you’re buying, selling, or investing in Austin
The numbers only matter if they change what you do next. Here’s how we’d translate the current data into action depending on where you sit.
- Buyers: get preapproved before you shop, build a shortlist of two or three neighborhoods that fit your budget band, and prioritize an inspection that flags foundation and HVAC issues common in older Austin housing stock.
- Sellers: price against recent sold comps rather than list prices, time your listing to align with seasonal buyer activity, and invest in professional photography and broad listing exposure rather than relying on foot traffic alone.
- Investors: focus on suburbs like Round Rock and Georgetown for stronger rental yield potential relative to purchase price, stress-test financing against a higher-rate scenario, and factor property tax and insurance trends into your net return before closing.
- Renters weighing the buy-versus-rent decision: if you’re not ready to commit to a purchase, exploring shared housing arrangements can reduce monthly costs while you build savings toward a down payment.
How we read the Austin market on the ground in 2026
Negotiation in 2026 looks different than it did three years ago. We’re seeing more buyers successfully ask for repairs, closing cost credits, and occasionally a price reduction after inspection, something that was far less common during the 2021 seller’s market. Sellers who price realistically from day one are closing faster than those who test the market high and chase it down later.
Part of how we support pricing accuracy is through analysis of recent sold data paired with broad digital marketing exposure for active listings. That combination helps set a defensible asking price and gets a listing in front of more qualified buyers faster, which matters in a market where overpricing by even a small margin can add weeks to a sale.
Pro Tip: Ask any agent you’re considering for their actual sold-to-list ratio on recent listings, not just their list price, it tells you how close their pricing strategy comes to reality.
Pricing accuracy and exposure matter more in a balanced market than they did in a seller’s market, because buyers now have the leverage and the data to call out an overpriced listing immediately.
— Vladimir
Historical home price trends over the past 5 to 10 years
Austin’s housing market over the last decade has moved through three distinct phases. From roughly 2015 through 2019, prices rose steadily but predictably, tracking the city’s growing reputation as a tech hub without the dramatic spikes that came later. That changed sharply starting in 2020, when a wave of relocation, historically low mortgage rates, and limited inventory pushed prices up at a pace few other major metros matched through 2021 and into early 2022.
The correction that followed was just as notable. As mortgage rates climbed through 2022 and 2023, Austin saw one of the more pronounced price pullbacks among major U.S. metros, a direct consequence of how far prices had run up during the boom. By 2024, the market had largely found its footing, and 2025 into 2026 has looked more like the slow, steady pattern of the pre-2020 years than either the boom or the correction.
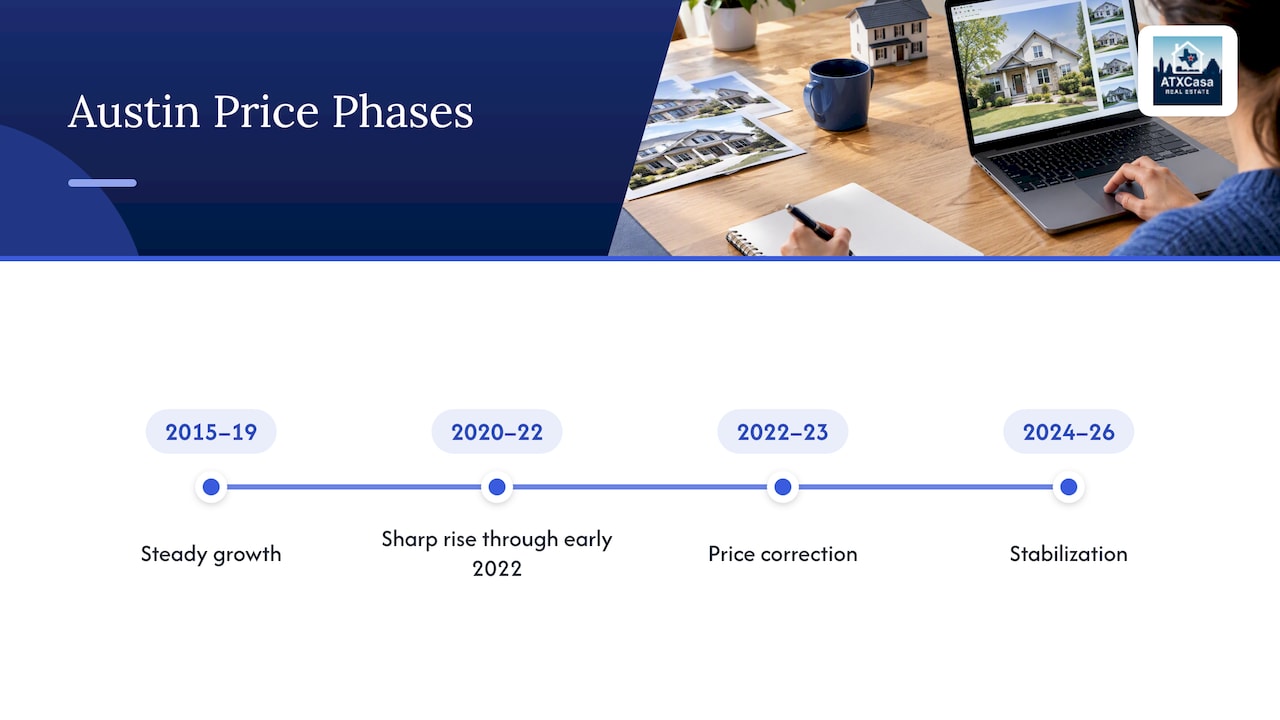
For buyers and sellers today, the practical takeaway is that the extremes of 2021 and 2023 were both unusual by Austin’s own historical standards. The current market, flat to modestly moving, more closely resembles the city’s longer-term norm than either of those outlier periods.
How Austin home prices compare to other Texas and national metros
Austin tends to sit above most other major Texas metros on price, a gap that opened wide during the 2020 to 2022 boom and has narrowed somewhat since. Compared to Dallas-Fort Worth, Houston, and San Antonio, Austin generally commands a premium tied to its tech-sector job base and the geographic constraints of the hill country limiting how far the city can sprawl affordably.
Nationally, Austin’s price correction after 2022 was sharper than in many other large metros, which has closed some of the gap between Austin and higher-cost coastal markets while still leaving it priced above most of the rest of Texas. That relative positioning matters for anyone relocating from a lower-cost Texas metro and expecting Austin prices to feel similar.
For investors comparing markets, Austin’s combination of a strong job base from continued metro employment growth and a now-moderated price level makes it a market worth weighing against Dallas-Fort Worth or San Antonio on a cost-per-job-created basis rather than price alone. The suburbs, particularly Round Rock and Georgetown, often provide a more direct price comparison to peer Texas metros than central Austin does.
How property taxes and local fees affect affordability
Property taxes are a bigger factor in Austin’s overall affordability picture than in many other states, since Texas has no state income tax and leans more heavily on property tax revenue to fund local services. For homeowners, that means your effective monthly housing cost includes a meaningful tax component on top of principal and interest.
For eligibility rules, consult the general homestead exemption. Texas Comptroller guidance says a qualifying general residence homestead exempts part of a principal residence’s appraised value. Eligibility requires an ownership interest and use as the principal residence. Owners must apply in most circumstances; the general deadline is before May 1, and the county appraisal district determines eligibility. Qualified buyers who acquire a home after January 1 may receive the exemption for the applicable part of that tax year if the previous owner did not receive the same exemption.
Beyond the exemption itself, local budget decisions affect what homeowners actually pay each year. Utility rates and municipal fees have shifted in recent years alongside city budget priorities, and we’ve tracked these 2026 property tax and utility changes in detail because they compound with mortgage payments to shape true monthly carrying costs. Buyers comparing a slightly higher-priced home in one taxing jurisdiction against a lower-priced home in another should run the full tax math before assuming the cheaper sticker price is actually the cheaper monthly payment.
Where the investment opportunities are across Austin property types
Investors looking at Austin in 2026 are weighing a market that’s less about rapid appreciation and more about steady rental demand and selective value plays. Single-family rentals in Round Rock and Georgetown tend to offer a more favorable balance between purchase price and achievable rent than comparable properties closer to downtown Austin, where purchase prices climb faster than rents can follow.
Multifamily and small multi-unit properties remain limited within city limits but can offer stronger per-unit economics in some inner-ring neighborhoods where land values support redevelopment. New construction, particularly in planned communities in Georgetown, often comes with builder financing incentives that can improve an investor’s entry cost compared to chasing resale inventory in the same submarket.
For investors prioritizing cash flow over appreciation, the suburbs generally outperform central Austin on a rent-to-price basis right now, a direct result of the price gap between the urban core and outlying communities. Those prioritizing long-term appreciation potential may still find central Austin and close-in neighborhoods more compelling, provided they can absorb a higher entry price and more modest near-term cash flow.
What these numbers mean if you’re an everyday Austin household
If you’re a typical Austin household weighing a purchase this year, the opportunity is real: inventory gives you room to negotiate in a way buyers didn’t have in 2021. The caution is just as real: payment math at current rates still stretches many budgets, so get specific about your number before you fall for a listing.
Include property taxes in a home’s ownership-cost estimate and check residence-homestead eligibility with the local appraisal district. Texas Comptroller guidance says a qualifying general residence homestead can exempt part of a principal residence’s appraised value, while local appraisal districts decide eligibility.
How ATXCasa can help you navigate Austin’s 2026 market
Whether you’re buying your first home in Round Rock, selling a property in central Austin, or evaluating a rental in Georgetown, we combine current local market reports with AI-assisted pricing analysis to help you make a decision backed by data rather than guesswork about where things stand.

We work directly with buyers, sellers, and investors across the Austin area, offering market reports, pricing strategy, and representation tailored to specific goals. If you want a clear read on what your budget or your home is actually worth in today’s market, visit ATXCasa to connect with our team and get started.
FAQ
What is the job market like in Austin?
In the Austin-Round Rock-San Marcos metro, BLS reported unemployment rates of 3.4% to 4.1% from March through August 2026. These figures are not seasonally adjusted; the August rate was 3.9% and preliminary. They provide labor-market context, not proof of housing demand.
What is the hardest month to sell a house?
National and local patterns both show the winter months, particularly November through January, tend to bring fewer buyers and slower sales compared to spring and early summer. Sellers listing during this window often need more patience and more competitive pricing to generate offers.
How much money do I need to live comfortably in Austin?
The comfortable income level depends heavily on your housing choice, since mortgage or rent payments make up the largest share of most budgets, and Austin’s property tax burden adds to ongoing homeownership costs. A realistic approach is to run your specific mortgage, tax, and insurance numbers against your income rather than relying on a generic citywide figure.
Is it cheaper to rent or buy a house in Austin?
The answer depends on your timeline and the specific property, since buying carries upfront costs and property taxes that renting avoids, while renting means missing out on building home equity. For those not ready to buy, exploring shared housing options can lower monthly costs while you save toward a future purchase.
Sources
- Bureau of Labor Statistics Data
- Scaling without breaking: How Austin tech companies are redefining growth in 2026
- Apply for the General Homestead Exemption | Travis County
- Austin-Round Rock-San Marcos, TX Economy at a Glance