
Austin multifamily cap rates are sitting between roughly 5.0% and 5.41% as of Q2 2026, depending on who is measuring and which asset class they track. After years of expansion, the increase has largely stopped. Single-family rentals look very different: on median prices and rents, the yield is far lower. Below I explain where the numbers come from, why they disagree, and how I would use them before making an offer.
TL;DR
- Matthews put the average Austin multifamily cap rate at 5.41% in Q2 2026, while Northmarq described pricing as stabilizing near 5.0%. Both say expansion has largely paused.
- Supply is the story: Q2 completions fell 56.4% year over year, and vacancy dropped to 12.29% from a 15.78% peak in Q3 2024.
- A single metro-wide cap rate hides big gaps by asset class (A vs. B/C) and submarket (North Austin vs. East Central and San Marcos).
- Single-family rentals at median Austin prices produce a much lower cap rate than apartments, so the return case depends on appreciation, rent growth and financing, not yield alone.
Table of Contents
- What a cap rate tells you (and what it does not)
- Where Austin multifamily cap rates stand in Q2 2026
- Rents and vacancy: the inputs behind NOI
- Cap rates vary by asset class and submarket
- What about single-family rentals and small multifamily?
- How I would underwrite an Austin deal right now
- Our perspective
- Working with ATXCasa on an investment purchase
- FAQ
- Sources
What a cap rate tells you (and what it does not)
A capitalization rate is a property’s net operating income (NOI) in one year divided by its price or value. NOI is rent and other income, minus vacancy and operating expenses: property taxes, insurance, maintenance, management and utilities you pay. It excludes your mortgage payment, depreciation and income taxes.
A simple, hypothetical example:
| Line | Amount |
|---|---|
| Gross scheduled rent | $60,000 |
| Vacancy and credit loss (8%) | -$4,800 |
| Operating expenses (taxes, insurance, repairs, management) | -$25,200 |
| NOI | $30,000 |
| Purchase price | $600,000 |
| Cap rate | 5.0% |
The same $30,000 NOI at a 5.41% cap rate implies a value of about $554,529. At 5.0% it implies $600,000. That gap of roughly $45,000 on one small building is why the source of a cap rate matters.
Three limits are worth keeping in mind:
- It is a snapshot. It uses one year of income and says nothing about next year’s rent growth or the cost of a new roof.
- It ignores financing. Two buyers can pay the same price at the same cap rate and earn different cash returns because their loans differ.
- It depends on whose NOI you trust. Seller-prepared numbers often understate expenses, especially Texas property taxes and insurance.
Where Austin multifamily cap rates stand in Q2 2026
Two respected research publishers give slightly different readings for the same quarter:
| Source | Q2 2026 reading | What it measures |
|---|---|---|
| Matthews | 5.41% average cap rate | Broad multifamily average |
| Northmarq | Stabilizing near 5.0% | Transaction-focused view of the market |
The difference of about 40 basis points is not an error. Averages change with which sales are included, how old the buildings are, and whether a deal was a stabilized asset or a value-add play. Matthews also described the 5.41% figure as the 17th consecutive quarter of expansion, meaning cap rates (and therefore yields) rose for more than four years as prices adjusted. The more useful point is the direction: published commentary now describes that expansion as largely over.
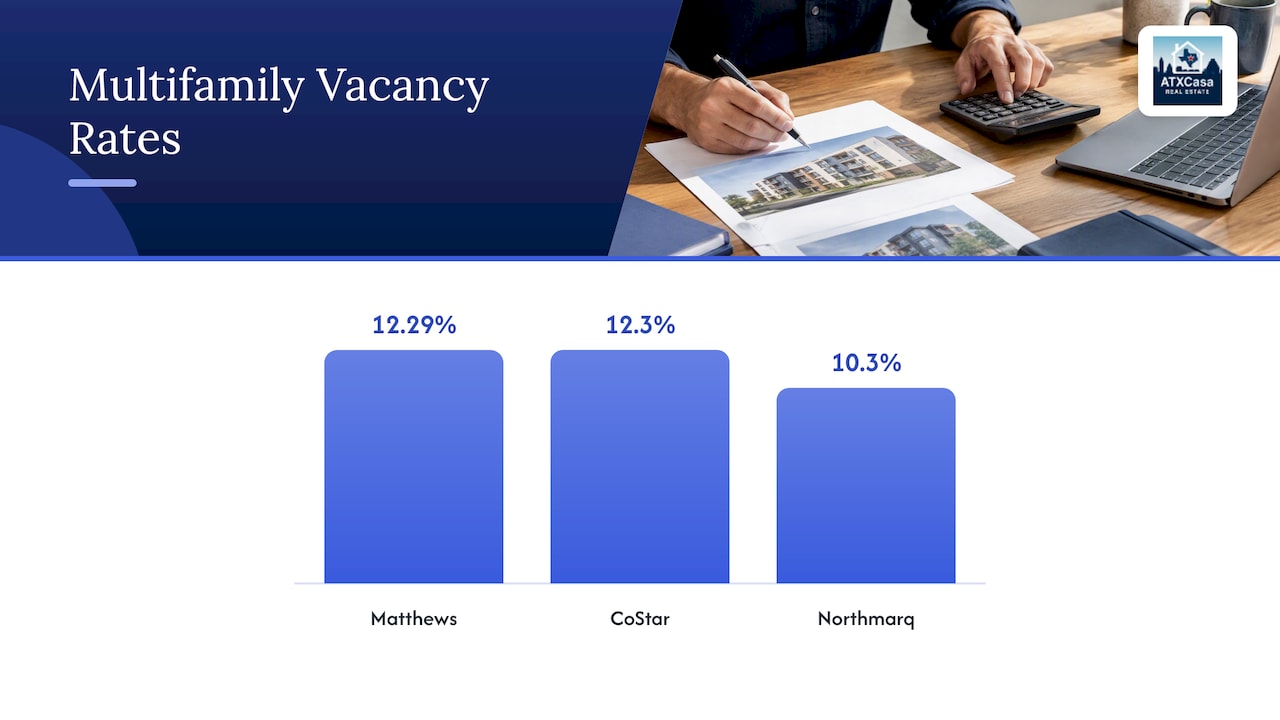
Vacancy numbers differ by source too. Matthews reports 12.29% for Q2 2026, and CoStar’s multifamily vacancy update shows 12.3%. Northmarq’s report shows 10.3%. Different property samples explain that, and it is a reminder to compare like with like. When I read a report, I note the source of each number before I compare it with anything else.
Why cap rates rose and why they are leveling
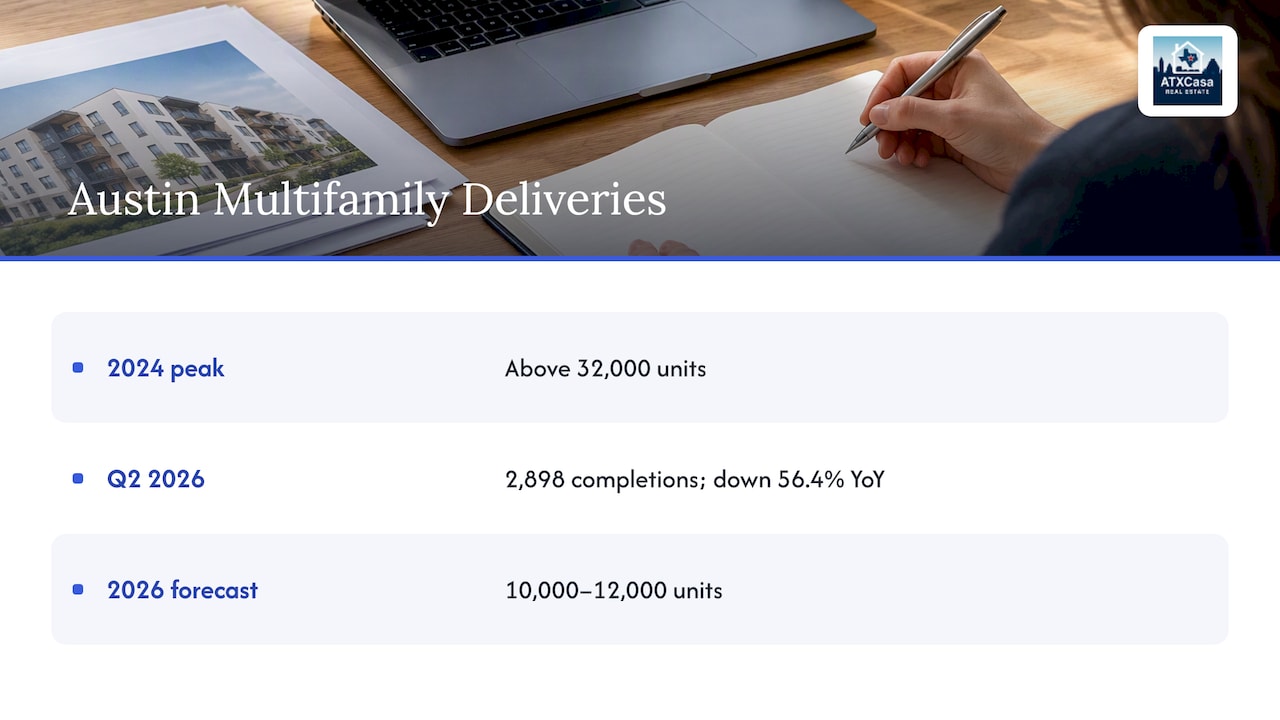
The supply cycle is the main driver. Deliveries peaked above 32,000 units in 2024, and forecasts for 2026 sit around 10,000 to 12,000, according to Matthews. In Q2 2026 alone, completions were 2,898 units, down 56.4% from a year earlier. Northmarq links the turning point to record absorption combined with a shrinking construction pipeline, and notes it ended a 12-quarter stretch of rent declines that began in 2023.
My read: this is a supply-side correction rather than a sudden surge in demand. That matters, because the pace of rent growth from here depends on how quickly leftover units are absorbed, not on a headline about Austin’s popularity.
Rents and vacancy: the inputs behind NOI
Cap rates only mean something next to the income they are built on. A few current data points:
- Effective rent: Matthews shows $1,414 for multifamily, down 3.88% year over year, so annual rent growth is still negative in that dataset.
- Quarterly change: Northmarq reported the first quarterly rent increase in three years in Q2 2026, at 1.8%, as covered in its rent reversal write-up.
- All-property average rent: Zillow lists $1,964 for Austin as of its mid-October 2026 update, down $31 from the previous month.
So the trend is flattening, not surging. If you underwrite a purchase on 5% annual rent growth, you are betting against current data. I would model flat to modest growth for the first year, then test what happens if vacancy stays near 10% to 12%.
Cap rates vary by asset class and submarket
A metro average is a starting point, not a target. Two patterns stand out in the 2026 reports.
Class A versus Class B/C. Northmarq’s analysts describe investors moving from cautious to active, particularly in Class B and C properties, where they see a faster fundamental recovery than in the Class A segment still working through new supply. The picture is not uniform nationally: one Q2 2026 report notes that Austin’s Class A vacancy is lower than its Class C rate, which is the opposite of the national norm, with Class A strength concentrated around the city core. In other words, check which class and which location a statement refers to.
North Austin versus the rest. Northmarq notes that submarkets such as East Central and San Marcos still carry the burden of earlier deliveries, while North Austin shows faster investment and operating momentum. It also reports that first-half transaction activity was the highest since 2022, supported by several Class B sales along the northern suburban corridor. That corridor includes Cedar Park, Round Rock and Georgetown, the areas we work in every week.
If you want to see how neighborhood-level pricing differs inside the metro, our look at what sold homes reveal about Austin neighborhood prices is a useful companion. Investors in other markets use dedicated site-analysis tools to compare zoning, costs and end values address by address, such as this feasibility reporting service for New South Wales sites. It covers Australia, not Texas, but it shows the kind of submarket-by-submarket thinking Austin deals deserve.
What about single-family rentals and small multifamily?
Most of the headline numbers above come from larger apartment communities. Many of our readers are buying a house, a duplex or a small investment property instead, and the math is different.
One third-party estimate, based on a median rent of $1,560 and a median price of $425,000, arrives at a cap rate of about 1.70% for a typical Austin single-family rental once Texas property taxes, insurance, maintenance and vacancy are subtracted. Treat that as a rough median-based model, not a quote for any specific house. But the lesson is solid: a median Austin house rarely produces an apartment-style yield on income alone.
That does not make it a bad investment. It means the case rests on other things:
- Buying below the neighborhood median, or in a lower-priced suburb where rent-to-price ratios are better
- Controlling property tax exposure by appealing assessments where warranted
- Using financing that keeps monthly cash flow neutral or better
- Holding long enough for appreciation and rent growth to matter
For suburb-level yield comparisons, see our Austin rental investment guide to suburb yields in 2026. For the price side of the equation, Austin home prices in 2026 explains how flat prices change negotiating room.
How I would underwrite an Austin deal right now
Use this order. It keeps you from anchoring on a pretty percentage.
- Rebuild the NOI yourself. Replace the seller’s expenses with your own. Use current Travis or Williamson County tax estimates at your purchase price, a real insurance quote, and a realistic management fee even if you plan to self-manage.
- Set vacancy honestly. Metro vacancy is above 10% in the reports cited here. A stabilized, well-located building may do better, but model the downside.
- Compare to the right cap rate. Match your asset’s class, age and submarket to the narrowest data you can find, not to the metro average.
- Check the supply pipeline nearby. Ask how many units are under construction relative to existing inventory within a couple of miles. Future rent growth follows that ratio more than a static cap rate.
- Stress-test the exit. If cap rates move 50 basis points against you at sale, what happens to your return? On the $30,000 NOI example, moving from 5.0% to 5.5% lowers the value from $600,000 to about $545,455.
- Compare with safer alternatives. If your cap rate is lower than what you could earn with less risk, you need a clear reason, such as strong rent growth or a value-add plan.
Is 7.5% a good cap rate?
It depends on what is behind it. A 7.5% figure is above Austin’s multifamily averages, so ask why. It may reflect an older building with deferred maintenance, a weaker submarket, higher insurance or tax burdens that the seller left out, or a short lease-up risk. Higher can be better, but higher also signals higher risk.
Our perspective
We are skeptical of any article, ours included, that gives you one Austin cap rate and implies you can act on it. Our approach grows out of Vlad’s nearly two decades in IT: gather the data, check where each number came from, and only then form a view.
In our work across Austin, Cedar Park, Round Rock and Georgetown, the most common mistake we see is comparing a listing’s advertised return to a metro average. Advertised returns often use optimistic rents and leave out parts of the expense load. The metro average mixes buildings that are nothing like the one you are looking at.
We also believe the 2026 picture is more constructive than it was a year ago, with caveats. Falling completions, easing vacancy and the first quarterly rent gain in three years are real improvements. But rents are still lower year over year in some datasets, and the benefit is not evenly spread across submarkets. That is a case for buying selectively, with conservative underwriting and a clear view of the local pipeline, rather than buying the average.
If you are comparing buying now with waiting, our buy or wait guide for the Austin housing market walks through the trade-offs, and our Austin housing market overview tracks local data for buyers, sellers and investors.
— Vladimir
Working with ATXCasa on an investment purchase
If you are weighing a rental or multifamily purchase in Greater Austin, we can help you build the numbers from the ground up: neighborhood trends, realistic rent and vacancy assumptions, tax exposure and the hidden pitfalls that do not show up on a listing. Start at ATXCasa, tell us what you want to buy, and we will go through the underwriting with you. For ongoing numbers, follow our market insights.
FAQ
What is the current cap rate for multifamily housing in Austin?
As of Q2 2026, Matthews reports an average of 5.41%, and Northmarq describes the market as stabilizing near 5.0%. The spread reflects differences in method and the mix of properties. Use the range as a reference, and narrow it by asset class and submarket for any real deal.
Is a 7.5% cap rate good?
It is higher than current Austin multifamily averages, which means the market is pricing in more risk or the income figures need checking. Verify expenses, condition, tenant quality and location before treating it as a bargain. A higher cap rate is only better if the NOI is real and sustainable.
Is rent going up or down in Austin?
It is mixed, but flattening. Matthews shows effective rent down 3.88% year over year, while Northmarq recorded a 1.8% quarterly rent increase in Q2 2026, the first in three years. Zillow’s average rent was $1,964 in its October 2026 update, slightly lower than the month before.
Do cap rates matter for a single-family rental?
Yes, but they tell only part of the story. Median-based estimates put Austin single-family cap rates well below apartment cap rates, so appreciation, financing and tax management carry more weight. Calculate the cap rate using your own tax, insurance and maintenance numbers, then compare it with your cash flow after financing.
Sources
- Austin Multifamily Market Report Q2 2026, Matthews
- Austin Market Insights Q2 2026, Northmarq (PDF)
- Austin Market Insights Q1 2026, Northmarq (PDF)
- Austin multifamily rents begin to reverse three-year slide, Northmarq
- Apartments.com and CoStar multifamily vacancy update Q2 2026
- Average Rental Price in Austin, TX, Zillow
- Austin multifamily market report 2Q 2026, Institutional Property Advisors (PDF)
- Rent Analysis: Austin, TX, CapRateCity