
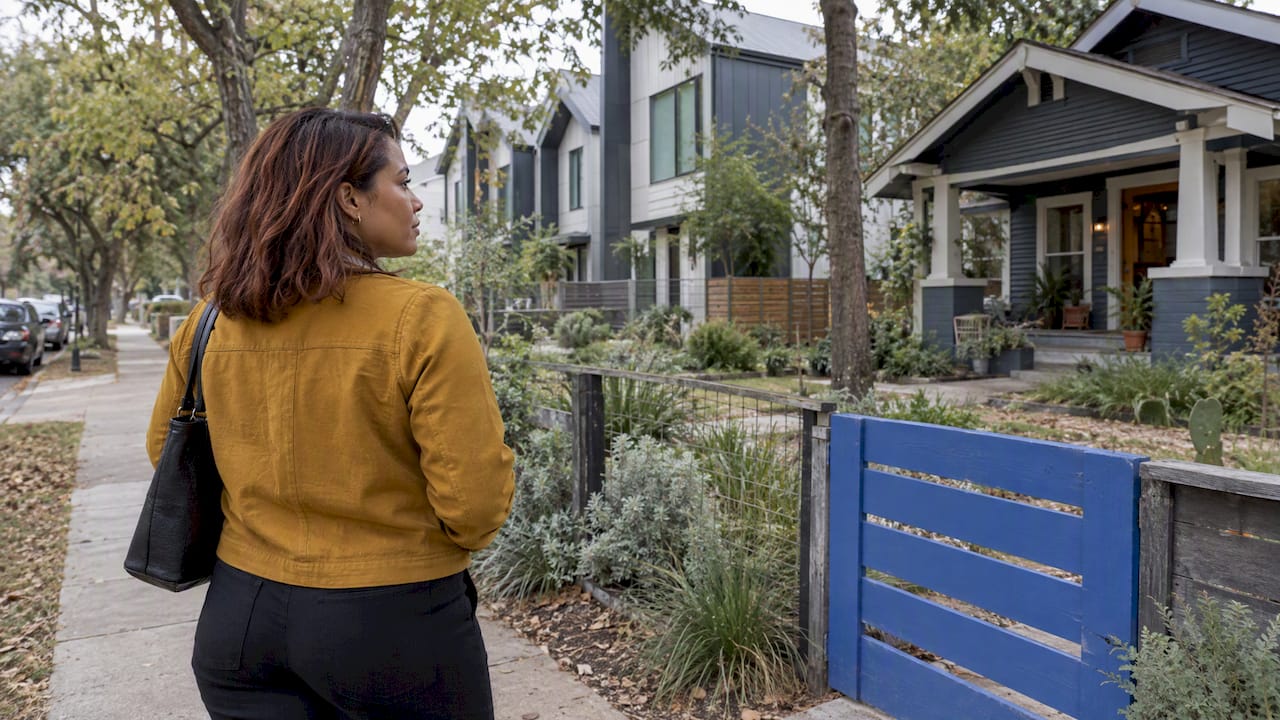
There is no single best neighborhood for an Austin investor. The right answer depends on whether you want rent income now, appreciation later, or a low-maintenance hold, and on how much property tax and vacancy risk you can carry. In 2026 the areas investors compare most often fall into two groups: central infill pockets such as East Austin, Mueller, Hyde Park and South Austin, and suburbs such as Cedar Park, Leander, Georgetown, Round Rock, Pflugerville, Hutto and Manor. Below I explain how they differ and how I would screen them.
TL;DR
- Central Austin pockets (78721 and 78722 in East Austin, Mueller, Hyde Park, South Austin) cost more per square foot but have deep renter demand and a tight supply of land.
- Northern and eastern suburbs usually offer lower entry prices and newer homes, but municipal tax rates differ widely: 0.353 per $100 in Georgetown against 0.535 in Pflugerville for 2025.
- Austin passed one million residents in 2025, which supports long-term demand, but rents and vacancy depend on the submarket and the year you buy.
- Judge a neighborhood by net cash flow after taxes, insurance, MUD or HOA charges and vacancy, not by the asking rent alone.
Table of Contents
- What “best for investment” should mean for you
- Why Austin still draws investors
- Central Austin: higher entry price, deep tenant pool
- The suburbs: lower entry prices, newer homes, tax differences
- Reading rental ZIP codes
- Costs that change the answer
- Risks and limits to weigh
- A five-step process for choosing
- Our perspective
- Talk through your shortlist with us
- FAQ
- Sources
What “best for investment” should mean for you
Search results for this topic mix three different goals, and I think that is why the lists contradict each other. A neighborhood that suits a buy-and-hold landlord rarely suits someone who wants a quick renovation and resale.
I sort investors into three groups:
- Cash-flow investors want rent that covers the mortgage, taxes, insurance and repairs with room to spare. They tend to look at suburbs and at older, lower-priced central areas.
- Appreciation investors accept thin early returns for a location with limited land and strong demand drivers. They tend to look at central infill.
- Balanced investors want a house that rents easily today and sells easily later. They tend to look at established suburbs with schools, jobs and shopping nearby.
Before comparing any two areas, write down which group you are in. The rest of the analysis follows from it.
Why Austin still draws investors
The City of Austin reports that it reached a population of 1,002,632 in 2025, based on Census Bureau estimates, and credits better-than-expected job growth and housing costs easing from pandemic-era peaks for helping it keep and attract residents. City staff also describe an economy with strength in advanced manufacturing, semiconductors, life sciences, clean tech and creative industries, and note that 52% of workers hold a post-secondary degree.
Those are demand-side facts. They do not guarantee returns. The same city update frames the future challenge as managing the effects of growth, particularly housing and childcare affordability. For an investor that cuts both ways: affordability pressure supports rental demand, and it also invites policy attention and new supply.
For the price side, my Austin home prices outlook for 2026 explains why flat prices and more room to negotiate change the math on a purchase.
Central Austin: higher entry price, deep tenant pool
East Austin
East Austin remains the most discussed central submarket for investors. Prices here are not uniform, and that is where the opportunity and the risk sit. Two neighboring ZIP codes can differ sharply in what a buyer gets for the money. If you want a block-level look, I wrote a buyer’s tour of 78721 and 78722 that shows how value shifts within a short distance.
What to check: how recently the street was redeveloped, whether comparable new townhomes have sold nearby, and whether the lot allows an additional unit under current city rules.
Mueller and Hyde Park
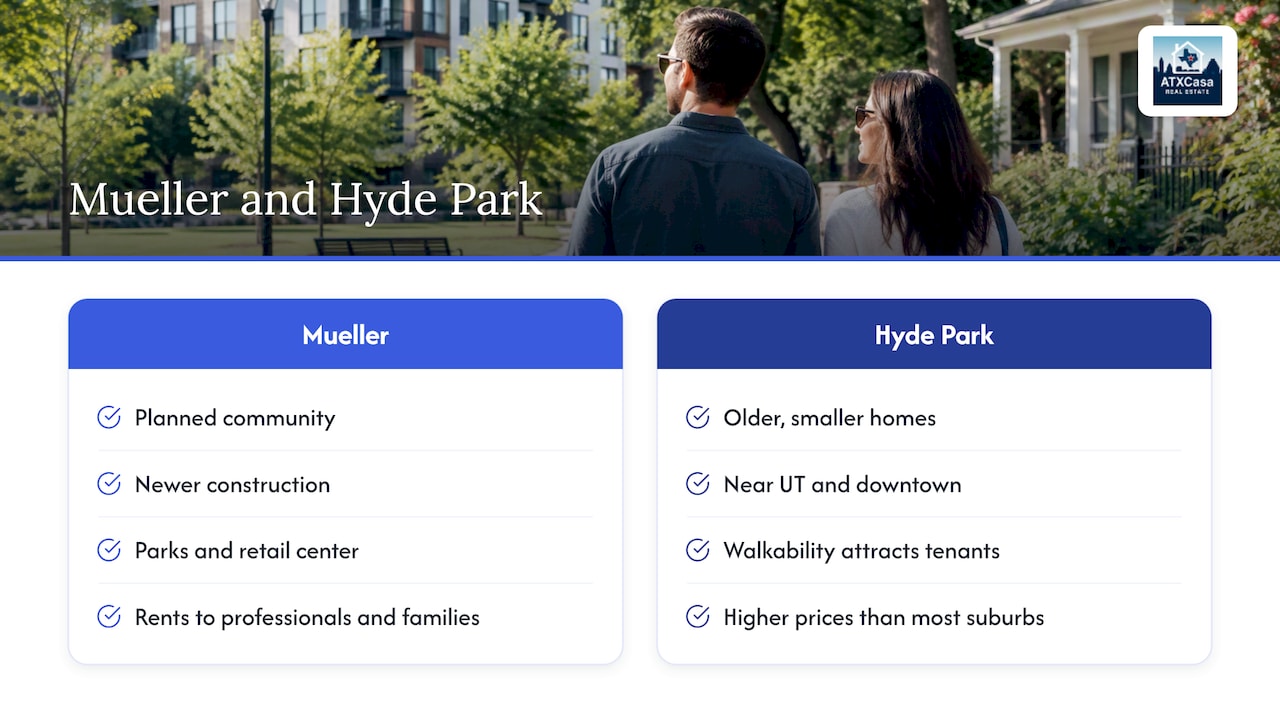
Mueller and Hyde Park appear on most ranking pages. Mueller is a planned community with newer construction, parks and a retail center, which makes homes easy to rent to professionals and families. Hyde Park has older, smaller homes close to the University of Texas and downtown, which suits tenants who value walkability. Both carry higher purchase prices than most suburbs, so the rent has to be strong to justify the price. Expect the return to come more from appreciation and low vacancy than from monthly cash flow.
South Austin
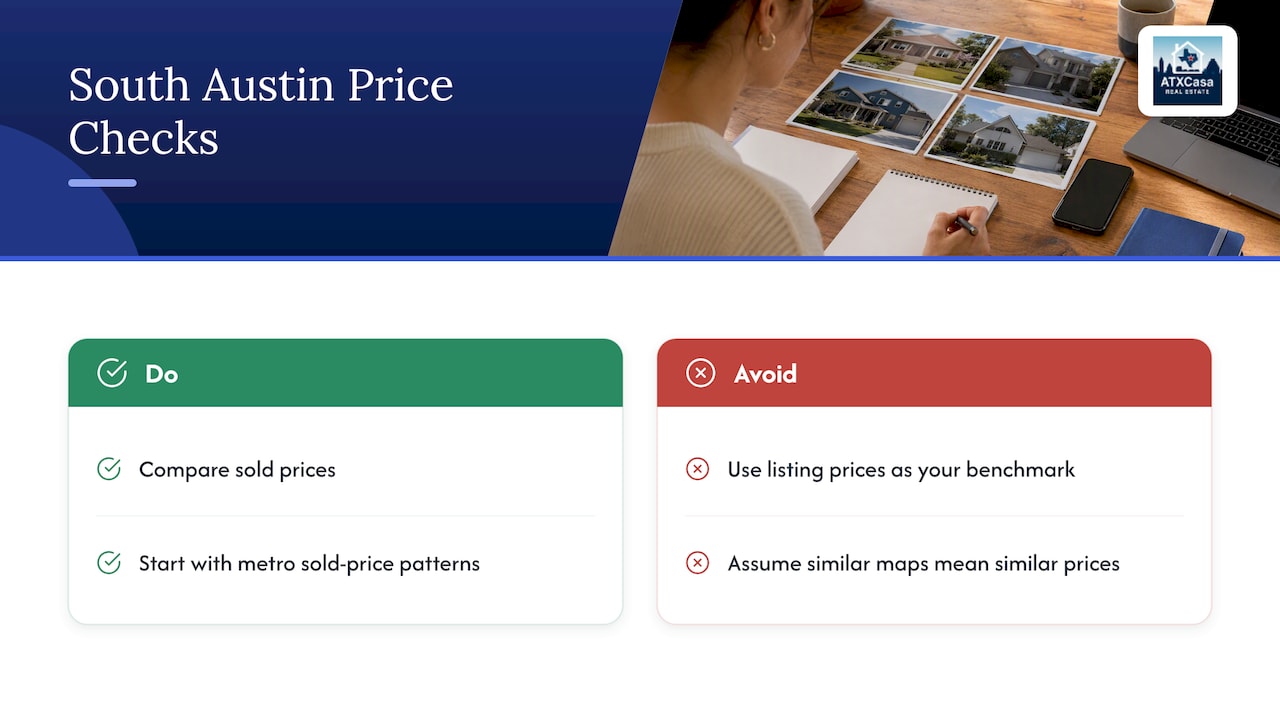
South Austin is a patchwork. Price gaps of $200,000 to $300,000 can separate neighborhoods that look similar on a map, which I cover in my guide to South Austin neighborhoods. For an investor, that means a careful comparison of sold prices, not listing prices, before you assume an area is cheap or expensive.
The sold-home price patterns across the Austin metro are the right starting point for that comparison.
The suburbs: lower entry prices, newer homes, tax differences
Cedar Park, Leander, Georgetown, Round Rock, Pflugerville, Hutto and Manor come up repeatedly as rental-property areas. They share larger lots or newer floor plans, and often a commute of 25 to 45 minutes to central Austin or to employers along the northern tech corridor. They differ a great deal in tax cost and in how much new construction competes with your rental.
Municipal tax rates compared
Williamson County publishes its 2025 tax rates by jurisdiction. The displayed city rates are per $100 of taxable value. A specific parcel can have county, school, city and special-district charges. The last column illustrates annual city tax on an assumed $400,000 taxable value; it is not a full tax bill or a quote.
| City | 2025 municipal rate | City portion on $400,000 |
|---|---|---|
| Georgetown | 0.353000 | $1,412 |
| Cedar Park | 0.360000 | $1,440 |
| Hutto | 0.385928 | $1,544 |
| Leander | 0.417282 | $1,669 |
| Pflugerville | 0.535000 | $2,140 |
At a $400,000 taxable value, the illustrated annual difference between the displayed Georgetown and Pflugerville city rates is $728 before other taxing units. Actual tax bills can change with taxable value, rates, exemptions and applicable districts. My property tax comparison by city covers the school district and county layers that complete the picture.
A note on Brushy Creek
Williamson County’s 2025 table lists a Brushy Creek MUD rate of 0.386837 in its MUD section and a separate Brushy Creek MUD Defined Area rate of 0.090000. Confirm the taxing entities for the specific parcel before estimating a bill.
How the suburbs differ in practice
- Cedar Park and Leander: established growth corridors with new-build and resale choices. Expect competition from builders offering incentives when you buy resale, and when you list a rental.
- Georgetown: the lowest municipal rate in the table, with an older historic core and newer subdivisions. A fit for balanced, long-hold investors.
- Round Rock: close to major employers and the interstate, which tends to keep tenant demand steady.
- Pflugerville, Hutto and Manor: typically lower purchase prices and rents, with more new supply. Run the tax and special-district costs carefully, because thin margins disappear quickly.
For a deeper look at returns by suburb, see suburb rental yields in 2026, and for a shortlist aimed at buyers, my guide to three Austin suburbs.
Reading rental ZIP codes
Readers often ask for the best rental ZIP codes. I would not rank them by a single number. Use three measures together:
- Rent relative to purchase price. A ZIP code with rents that look strong but prices that are higher can return less than a cheaper area.
- Time on market for rentals. Ask a property manager how many days a comparable unit sat vacant over the last twelve months.
- Competing supply. Count apartment complexes and new single-family rental communities within a mile or two. They set the ceiling on what you can charge.
Fair Market Rent figures published for federal programs show how widely rents vary across Austin ZIP codes, with the downtown core at the top and outlying areas such as Del Valle and Manor far lower. Those are program benchmarks, not market rents, so treat them as a floor for comparison and confirm against current listings and a manager’s opinion.
Costs that change the answer
A listing price and a rent estimate are only two of the inputs. Before I would call a property a good investment, I want these in the spreadsheet:
- Property taxes for every taxing unit, not only the city.
- MUD or PID assessments, which can appear on newer subdivisions.
- HOA dues, and any rental restrictions in the HOA rules.
- Insurance, including wind and hail coverage in Central Texas.
- Vacancy, using at least one month a year as a planning figure, more in areas with heavy new supply.
- Maintenance and capital reserves, higher for older central homes.
- Property management, usually a percentage of collected rent if you are not self-managing.
Suppose a suburban house rents for $2,300 a month. Annual rent is $27,600. If you assume one month of vacancy, collected rent is $25,300. Subtract $1,440 in city tax on a $400,000 value, plus school and county taxes, insurance, repairs and management, and the remainder can shrink quickly. That is why I run each property through the full list and not a rule of thumb.
Risks and limits to weigh
Austin is a viable investment market, but it is not a one-way bet.
- Supply risk. Large apartment and build-to-rent deliveries can soften rents in a submarket, especially in outlying areas.
- Price risk. Prices have corrected from 2022 peaks, and buyers who bought at the top may still be waiting. My 2025 buyer opportunity analysis explains what that correction means for negotiating.
- Tax risk. Appraisals and rates change every year. Underwrite on a higher tax bill than the seller’s current one.
- Policy risk. The City’s housing blueprint aims to direct at least 75 percent of new housing to a half-mile around designated activity centers and corridors. That can raise the value of well-located lots, and it can also add competing supply nearby.
The City’s own guidance for buyers points toward healthy market signals, such as recent transaction volume and property condition, in preference to broad median price trends. I agree. A median across a ZIP code hides the specific house you are buying.
A five-step process for choosing
- Define your goal: cash flow, appreciation or balance.
- Narrow to three or four areas by budget and commute to major employers.
- Pull sold prices and rental comparables for the last six to twelve months in each.
- Build a net-return model with all taxing units, insurance, vacancy and reserves.
- Inspect the property and review HOA and special district documents before the option period ends.
Our perspective
We built ATXCasa around the idea that investors make better decisions with local data than with ranked lists. Our founder spent nearly two decades in IT before becoming a Realtor, and that shows in how we work: we compare sold prices, tax layers and rental comparables across Cedar Park, Round Rock, Georgetown and the central neighborhoods, and we say plainly when a promising area does not pencil out.
My read is that central Austin suits investors who can accept thinner early returns for location, while the suburbs reward those who track tax rates and new supply closely. Neither is automatically better. The investors we see do well are the ones who run the numbers on a specific address, not a neighborhood name.
— Vladimir
Talk through your shortlist with us
If you are comparing two or three Austin-area neighborhoods, we can walk through sold comparables, tax layers and rental demand for your budget. Start at ATXCasa, or read our market insights and neighborhood guides first.
FAQ
Where is the best place to invest in Austin?
It depends on your goal. For rent income and lower entry prices, investors often compare Cedar Park, Georgetown, Round Rock and Leander. For long-term appreciation with a thinner yield, they look at East Austin, Mueller and Hyde Park. Run a net-return model on a specific property before you decide.
Is Austin, TX a good place to invest in real estate?
Demand fundamentals are solid: the city passed one million residents in 2025 and has a diverse employment base. The risks are new rental supply, property taxes and prices that have not fully recovered from earlier peaks. A good deal is still one that works after all costs.
Which Austin suburb has the lowest property tax?
Among the five cities compared in the table, Georgetown has the lowest listed 2025 municipal rate, 0.353 per $100, just below Cedar Park at 0.360. That is only a city rate; confirm all taxing entities for the specific address.
What are the best rental ZIP codes in Austin?
There is no fixed list, because rent, vacancy and competing supply change by year. Compare rent against purchase price, how long comparable units sit vacant, and how much new construction is nearby. A local agent or property manager can give you current figures for the ZIP codes on your shortlist.
Sources
- Austin Population Milestone: One Million and Counting
- Workforce Development & Childcare Update (City of Austin)
- Imagine Austin Year 10 Report
- 2025 Tax Rates and Exemptions by Jurisdictions (Williamson County)