
The latest reading for the Austin-Round Rock area is a median of 80 days on market for September 2026, up from 67 days in July. That is a long wait by Austin’s own history, and the number you see depends heavily on who measured it, which area it covers and whether it is a median or an average. Below I explain how days on market (DOM) is calculated, what recent figures show, why neighborhoods differ so much, and how to use the number when you buy, sell or invest.
TL;DR
- The Austin-Round Rock median was 80 days in September 2026, up from 67 in July, according to Realtor.com data published by the St. Louis Fed.
- Different sources report 57, 62, 80, 89 or 106 days for “Austin” because they use different areas, periods and definitions. Compare like with like.
- Homes that sold at or above their original list price took 23 days in one 2025 study, versus 97 days for homes that sold below list.
- Buyers can use longer DOM as negotiating context. Sellers can use it to judge whether the price is wrong, not just the market.
Table of Contents
- What days on market means and how it is measured
- Austin days on market right now
- Days on market by city, county and ZIP code
- What makes one Austin home sell faster than another
- How to use DOM if you are buying
- How to use DOM if you are selling
- If you are investing
- Our perspective
- Talk through your own numbers
- FAQ
- Sources
What days on market means and how it is measured
Days on market counts the time between the day a home is listed and the day it stops being available. The end point is where sources differ. The Texas A&M Real Estate Research Center defines DOM as the time from listing until the property enters its final pending period, and notes that fewer days indicate stronger demand relative to supply.
The federal series most often cited for Austin works a little differently. Realtor.com measures its figure as the median number of days from listing date to closing, pending or off-market status, depending on what data is available. The monthly series for the Austin-Round Rock area is not seasonally adjusted, so a summer figure and a winter figure are not a clean like-for-like comparison.
Three details change what a DOM number tells you:
- Median versus average. A median is the midpoint, so a few stale listings do not move it much. An average is pulled up by listings that sit for many months. Average figures usually run higher in a slow market.
- Listed-to-pending versus listed-to-closed. Counting through closing adds roughly a month of contract-to-close time compared with counting to the pending date.
- Reset clocks. Relisting or switching agents can restart the count in some systems, which makes a home look fresher than it is. When I research a specific property, I check its full listing history rather than the number on the portal card.
The same dataset also carries a methodology warning. Realtor.com says releases since December 2021 and October 2022 are not directly comparable with earlier ones, so long-run comparisons across those dates need care.
Austin days on market right now
As of September 2026, the Austin-Round Rock median was 80 days, compared with 67 days in July. The change was 13 days (80 minus 67). Because this monthly series is not seasonally adjusted, compare the same month across years or use caution when interpreting a two-month change.
The longer view shows why buyers have had more room to negotiate. KXAN reported on February 16, 2026 that the Austin metro’s average time on market was 89 days in January 2026, the highest since March 2011, when it was 92 days. The Austin American-Statesman reported that a national brokerage’s data put Austin homes at a median of 106 days before going under contract in December 2025, up from 91 days a year earlier.
Here is how those readings line up:
| Measure | Area | Period | Days |
|---|---|---|---|
| Median DOM (Realtor.com via FRED) | Austin-Round Rock | July 2026 | 67 |
| Median DOM (Realtor.com via FRED) | Austin-Round Rock | September 2026 | 80 |
| Average time on market (KXAN) | Austin metro | January 2026 | 89 |
| Median days to contract (brokerage data via Statesman) | Austin metro | December 2025 | 106 |
| Average DOM (local title company) | City of Austin | April 2025 | 62 |
None of these is wrong. They answer slightly different questions. If you see a headline claiming Austin is at 57 days and another saying 106, ask which area, which month and which definition before concluding anything.
My read: the Austin-Round Rock figures provide context for a local comparison. The Texas A&M research associates longer DOM with weaker demand relative to supply, but that does not establish bargaining power for every seller or property segment. Compare similar homes before deciding whether a listing is taking unusually long to sell. For a wider view of supply, see our look at where Austin housing inventory stands and what 4.5 months of inventory means.
Days on market by city, county and ZIP code
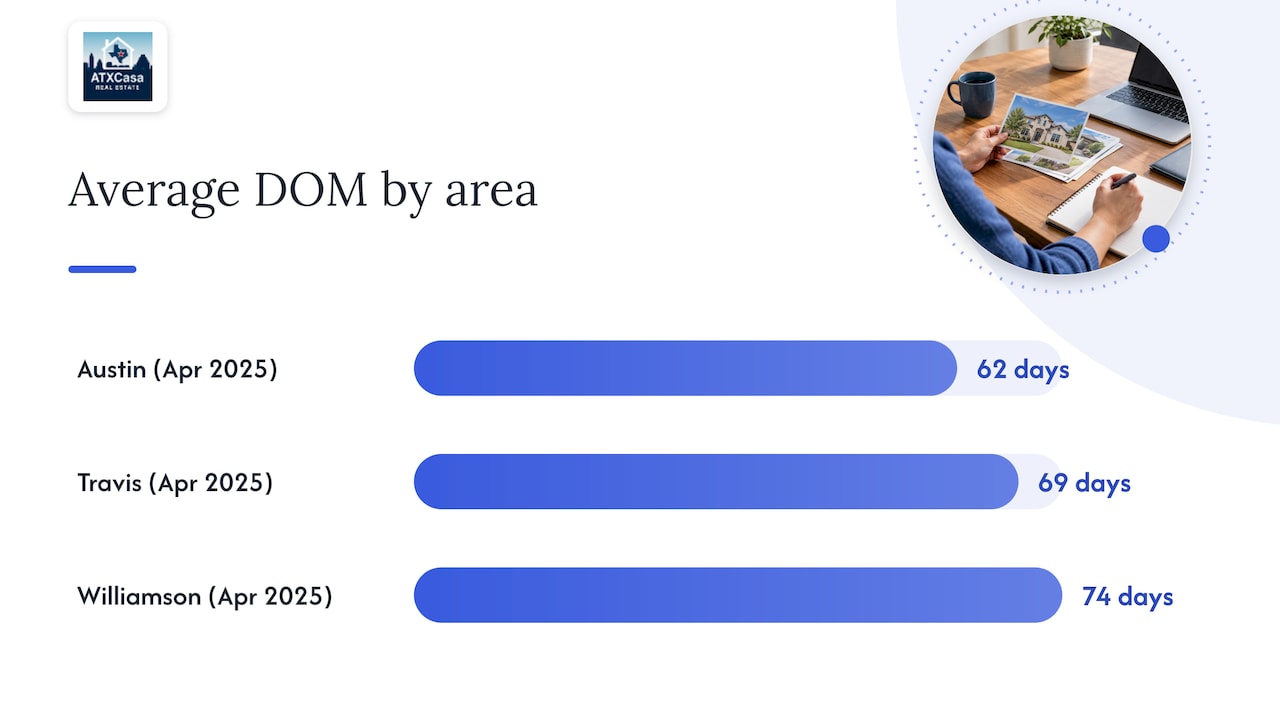
A metro-wide number hides a wide spread. A local title company’s April 2025 market-area statistics reported 62 average days on market for the City of Austin, 69 for Travis County and 74 for Williamson County, covering single-family homes, condos and townhomes. Those figures are older, but they show a pattern: the suburban ring tends to run a little slower than the city core.
ZIP codes spread much further. In January 2026, KXAN’s ZIP-level average market times ranged from 31 days in ZIP code 78618 to 346 days in ZIP code 78948. Small ZIP codes with few sales can produce extreme values, so treat the outliers as signals about thin data as much as about demand.
What explains neighborhood differences in practice:
- Price band. Entry-level homes in established areas tend to draw more buyers than luxury listings or large-lot properties, which have a smaller pool.
- Housing type. Condos, townhomes and new construction with builder incentives behave differently from resale single-family homes.
- Sample size. A ZIP code with a dozen sales in a month can swing by weeks on one stale listing.
- Condition and pricing quality. Two similar houses on one street can differ by months because of price, photos or condition.
If you are comparing neighborhoods, pair DOM with price data. Our guide to Austin neighborhood prices and what sold homes reveal shows how to do that.
What makes one Austin home sell faster than another
Market-wide DOM is the backdrop. Your own listing’s time is mostly decided by price and presentation. Unlock MLS research for the first quarter of 2025 found 23 days on market for homes that sold at or above original list price versus 97 days for homes that sold below it. The same study reported that below-list sales needed an average of 3.5 open houses, against 1.7 for homes that sold at or above the original list price.
Read that carefully. It does not mean a low price guarantees a fast sale, and it does not prove cause and effect. It does show that the homes which sold without reductions were generally the ones that were priced in line with the market from day one.
The factors I see matter most:
- Opening price against recent comparable sales. Pricing from sold homes, not from the asking prices of neighbors, keeps you inside what buyers actually pay. We walk through the method in how to use Austin sold-home data to price your home.
- The first two weeks. Most buyer attention is concentrated at launch. A price correction after a month often draws fewer eyes than the right price at launch.
- Condition and presentation. Photos, staging and obvious repairs shape whether a showing becomes an offer.
- Property-specific issues. Flood-zone questions, foundation concerns, an HOA with high dues or a high tax rate narrow the buyer pool and lengthen DOM.
- Seasonality. In the Texas MLS series studied from January 2012 through July 2016, average DOM was higher in the first two months of the year and lower in midsummer. That historical market-level pattern is not a prediction of a particular home’s selling time.
In markets where supply is tight and buyers compete, DOM compresses and strategy shifts. How buyers approach that situation is covered in a piece on when to push for multiple offers in another metro, and the underlying logic of reading months of supply carries over.
How to use DOM if you are buying
A long market-wide DOM gives you context, not a discount. What it supports is a more careful, less rushed process.
- Check the property’s own history. As a hypothetical example, consider a home listed for 90 days. A matched benchmark of 30 days would give you more reason to investigate its price, condition and listing history than a benchmark of 80 days. In either comparison, match geography, property segment, reporting period and the definition of when the DOM clock stops. The metro median alone cannot establish whether that home is taking unusually long to sell.
- Look at price changes. A listing with two reductions tells you something about the seller’s position. Compare the current price with the original and with recent sold prices.
- Ask about prior contracts. A home that went pending and returned to active may have had inspection or financing issues. Your agent can ask the listing side what is safe to share.
- Use time to do diligence. When you are not in a bidding contest, you can inspect thoroughly, review the survey, check flood and tax details and negotiate repairs or credits.
- Do not assume every listing is negotiable. Well-priced homes in strong ZIP codes can still go quickly even when the metro number is high.
For how this plays out in the current market, see whether it is easier to buy a home in Austin in 2026 and our overview of Austin home prices in 2026.
How to use DOM if you are selling
Sellers sometimes read an 80-day median as the time they should expect. It is better used as a checkpoint.
- Set a review date. If your home has had no serious showing activity or offers within the first two to three weeks, the price or presentation is the first thing to review, not the market.
- Compare against your segment. Your benchmark is homes of similar price, size and location, not the metro figure.
- Plan for carrying costs. Every extra month adds mortgage, taxes, insurance and utilities, plus any second housing payment. Put that number next to the value of holding out for a higher price.
- Price to the sold data. Active listings show hope, sold homes show reality. Anchor to closed sales from the last 60 to 90 days in your area.
- Do not let the clock reset quietly. Relisting to hide days on market is easy for buyers’ agents to spot, and it can cost trust.
Our August 2025 Austin market recap for Travis and Williamson counties is a useful example of how I compare local numbers before recommending a price.
If you are investing
For investors, DOM is a liquidity measure. The Texas A&M Real Estate Research Center treats average DOM as a regional or local indicator of market status: demand relative to supply affects both prices and the quantity of homes sold, so DOM trends can help you assess conditions and revise pricing. It also suggests investors can weigh liquidity alongside expected yield.
Before buying a rental or flip, separate resale timing from tenant vacancy. Sales DOM can help you assess how readily comparable properties have sold if you need to exit the investment; it does not tell you how long a rental might sit empty. Use comparable sales to assess resale timing and separate rental-market evidence to estimate the time needed to find a tenant. A property may be easier to resell without being quicker to lease.
Our perspective
Days on market is one of the few numbers that moves with buyer behavior almost in real time, and it is also one of the easiest to misread. A single headline figure for “Austin” blends very different neighborhoods, price bands and measurement rules.
We built ATXCasa around the idea that you should see the number together with its definition, its geography and its date. Our approach comes from nearly two decades of IT experience applied to real estate: we pull the data, check how it was measured, and then translate it into a pricing or offer decision that makes sense for your specific home or target neighborhood.
For sellers, that means data-driven pricing and broad marketing exposure from the first day, because that is when the days-on-market clock does its most important work. For buyers and investors, it means a clear picture of neighborhood trends and the pitfalls a listing page does not show. We would rather give you an honest read on a home that has been sitting than a sales pitch.
Vladimir
Talk through your own numbers
If you are deciding when to list, what to offer or which part of Greater Austin fits your plan, I can look at the DOM and sold data for your specific area and price range. We help clients buy, sell and invest across Austin, Cedar Park, Round Rock and Georgetown.

Start at ATXCasa to request a market read for your neighborhood, or browse our Austin housing market data for buyers, sellers and investors first.
FAQ
What is the average days on market in Austin?
The most recent federal-series figure is a median of 80 days for the Austin-Round Rock area in September 2026. Other sources report averages or medians between roughly 57 and 106 days depending on the period, area and definition. Use the figure that matches your own question, such as your ZIP code and price range.
Is a long days-on-market figure good for buyers?
It generally means more choice and more time to negotiate, since demand is weaker relative to supply. It does not mean every home is discounted. Check the individual home’s price history and comparable sold prices before deciding how much room you have.
Why do different websites show different days on market for Austin?
They measure different things. Some count to the pending date and others to closing, some use medians and others averages, and the geography ranges from the city of Austin to the whole metro. A source may also use a different month or a different property mix.
How long should I expect my Austin home to take to sell?
Use the metro median as a rough starting point, then adjust for your price band, neighborhood and season. If your home has had little activity after the first few weeks, review your price and presentation with your agent against recent sold homes.
Does days on market include the time under contract?
It depends on the source. Some definitions stop when a home goes pending, while others run to closing or to off-market status. Always check the definition before comparing two figures.
Sources
- Housing Inventory: Median Days on Market in Austin-Round Rock, series page (FRED)
- Housing Inventory: Median Days on Market in Austin-Round Rock, table data (FRED)
- Liquidity of Texas Homes (Texas A&M Real Estate Research Center)
- Texas housing data (KXAN)
- Austin housing market ranked slowest in the country by days on market (Austin American-Statesman)
- Market Area Statistics, April 2025 (Pattent Title)
- Price It Right, Sell It Faster, Unlock MLS Research 2025
- When to push for multiple offers