
The best time to sell a house in Austin is usually spring, with April and May showing the shortest time on market. That said, the calendar is only one input. Pricing, condition and your own financial plans usually move the result more than the month on the listing. Below I walk through the seasonal data, what the Austin market looks like this fall, and how to decide between listing now and waiting.
TL;DR
- Realtor.com’s monthly Austin-Round Rock metro series recorded median listing times of 51 days in April 2026 and 91 days in January. These figures are not seasonally adjusted and do not predict an individual home’s time on market (FRED, Realtor.com data).
- ATTOM’s national 2015–2025 analysis reports premiums over automated estimated values for homes closing in March (10.7%), April and May (10.2%), September (8.0%) and October (7.9%). These are historical closing-month comparisons, not an Austin forecast (ATTOM).
- Higher mortgage rates increased monthly payments and affordability challenges for September 2026 buyers, although some buyers remained engaged (Unlock MLS).
- If you must sell before spring, list at a price that reflects current closed sales, not last year’s listings.
Table of Contents
- The short answer: spring wins on speed, price wins on results
- What the seasonal data shows for Austin
- Which month is the hardest to sell in?
- Where the Austin market stands this fall
- Sell now or wait for spring: how to decide
- Perspective
- Working backward from your listing date
- What to check before you choose a date
- Sell with a data-driven plan
- FAQ
- Sources
The short answer: spring wins on speed, price wins on results
If your timeline is flexible, plan to be on the market from mid-March through May. Buyers are most active then, days on market are shortest and national data shows the strongest sale premiums. If your timeline is not flexible (a job move, a purchase contingency, a carrying-cost problem), a well-priced home can sell in any month, and waiting for spring is not automatically the better financial choice.
I tell sellers to think about it in two layers. The first is seasonality, which is predictable and repeats every year. The second is the current market, which changes with mortgage rates, inventory and buyer confidence. A good decision accounts for both.
What the seasonal data shows for Austin
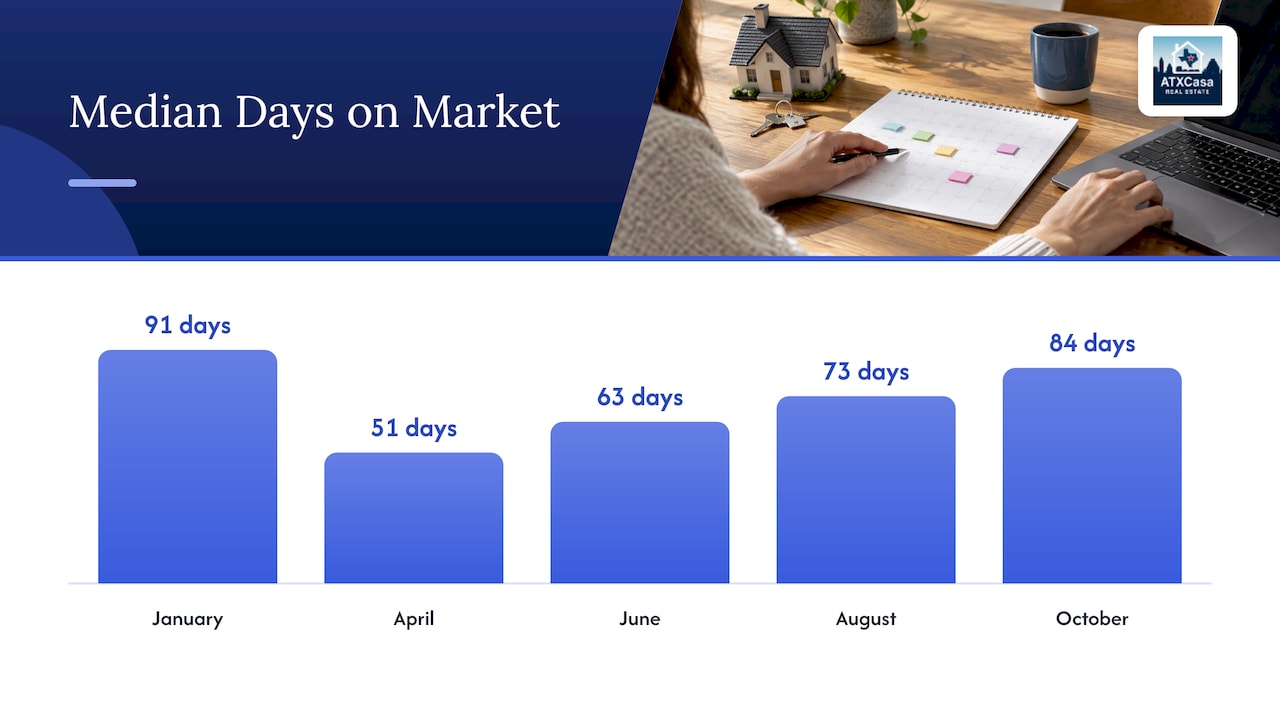
The cleanest long-run measure I know of is median days on market for the Austin-Round Rock metro, published by the Federal Reserve Bank of St. Louis from Realtor.com data. Here are the 2026 readings available so far, drawn from the FRED table and the FRED series page:
| Month (2026) | Median days on market |
|---|---|
| January | 91 |
| April | 51 |
| May | 56 |
| June | 63 |
| July | 67 |
| August | 73 |
| September | 80 |
| October | 84 |
The pattern is clear. Time on market bottoms out in April, then lengthens steadily through summer and fall, reaching its longest stretch in winter. A home that sits for 84 days in October is not necessarily overpriced; part of that is the seasonal slowdown.
Two cautions when you read this kind of data. FRED notes that the measure is monthly and not seasonally adjusted, so comparing April with January shows the season and the market mixed together. It also notes that Realtor.com changed its methodology, so figures released since October 2022 should not be compared directly with earlier ones. For your decision, that means comparing 2026 months with each other, or with recent years, rather than with a decade ago.
The best week to list
Realtor.com’s 2026 national analysis named April 12 to 18 as the best listing week. That national result should be distinguished from the Austin reported projection. The national analysis used seasonal trends from 2018 to 2025, excluding 2020. Its historical national measures were 1.3% higher prices, 16.7% more views per listing and 17% less time on market. Mortgage rates were excluded from the score, and these figures do not promise the same results for an Austin home.
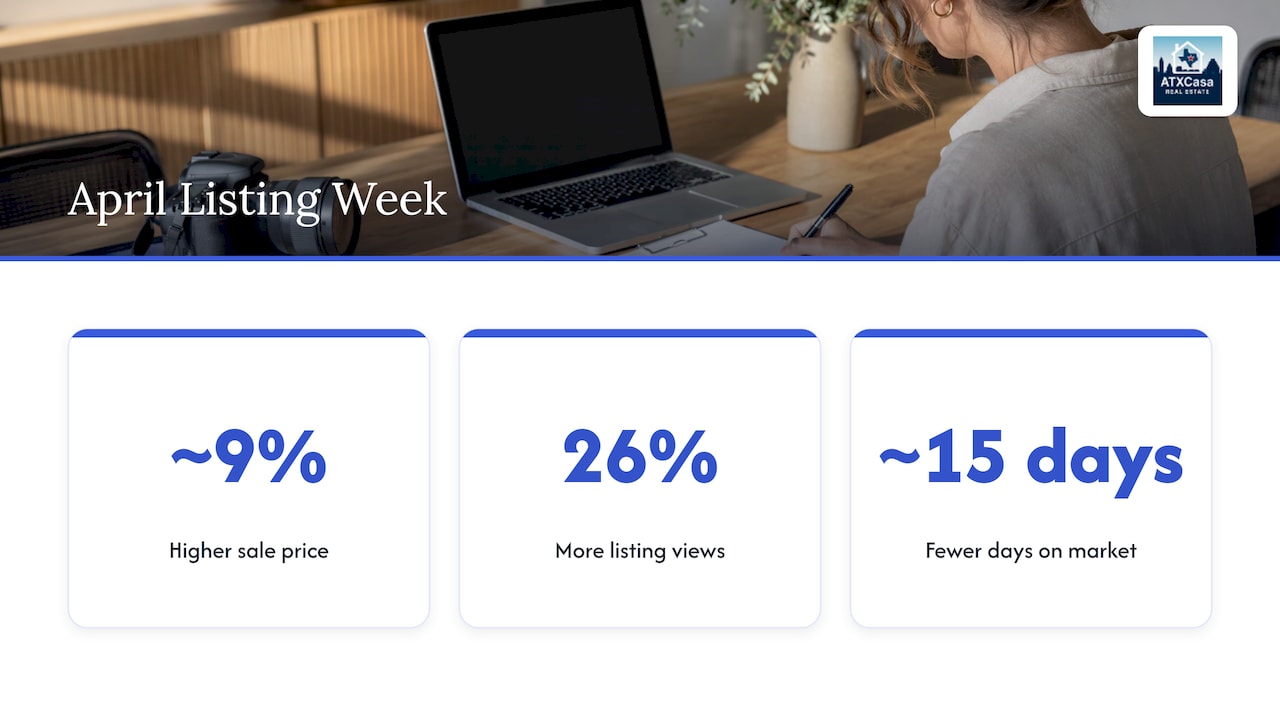
I would treat that as a signal for the season, not a promise for one week. A home that is ready, priced well and photographed properly in the last week of March will likely see similar buyer traffic. What the data does tell you is that being live by early April is a sound target.
Which month is the hardest to sell in?
Readers often ask for the worst month. ATTOM’s national analysis of 2015 to 2025 sales groups homes by purchase-closing date and shows the seller premium by month. The premium compares the median sale price with those same homes’ median automated valuation model (AVM) estimate at sale. An AVM is a computer-generated estimate of property value. This comparison does not measure how much a home gains by being listed in a different month:
| Month | Seller premium over estimated value |
|---|---|
| March | 10.7% |
| April and May | 10.2% |
| September | 8.0% |
| October | 7.9% |
October has the lowest national closing-month premium in ATTOM’s analysis, followed by September. Separately, January has the longest median listing time among the Austin-Round Rock 2026 readings shown above. These measures describe different places and outcomes; together, they do not establish a single weak season for every Austin home.
To illustrate only the national table’s arithmetic, assume a fixed estimated-value base of $450,000. The difference between the 10.7% March premium and the 7.9% October premium is 2.8 percentage points; applying that gap to the assumed base gives $12,600. This is not an estimate of an individual home’s sale price or the benefit of waiting. The table compares different groups of homes closing in different months.
Where the Austin market stands this fall
Seasonality tells you the usual shape of the year. The current market tells you where this year sits on that shape. As of the latest reports, here is what I would look at:
- Closed sales: Unlock MLS reports 2,223 closed sales in the Austin-Round Rock-San Marcos metro in September 2026, down 14.8% from September 2025 (Unlock MLS).
- Median sale price: The same metro’s September 2026 median sale price was $421,000, up 1.4% from September 2025.
- Pending sales: The same metro recorded 2,313 pending sales in September 2026, down 1.8% year over year.
- Price achieved: The metro’s average close-to-original-list-price ratio was 92.7% in September 2026. This compares closing prices with initial asking prices; it is not a valuation rule for an individual home.
- Listing prices: The Austin American-Statesman, citing Realtor.com’s October data, reported that the metro median listing price fell 10.2% year over year to $439,650, new listings fell 11.9% and median time on market rose by five days.
The Houston Chronicle reported a September median listing price of $446,450, down 9.8% from a year earlier, and noted that listing prices are not the same as closed-sale prices. That distinction matters. A falling median listing price can reflect which homes are being listed, not only what buyers are paying, which is why the closed-sale median in the Unlock MLS report ticked up while listing prices fell.
Unlock MLS attributes slower September activity to higher mortgage rates, which increased monthly payments and affordability challenges, although some buyers remained engaged. The report’s president advises buyers and sellers to base decisions on their goals and local conditions rather than trying to predict the broader market. For a seller, that supports checking comparable homes in the relevant neighborhood, price range and property type before choosing a price.
For a deeper look at supply, my write-ups on Austin housing inventory and on what 4.5 months of inventory means explain how to read months of inventory, and Austin home prices covers where negotiating room exists.
What 92.7% of original list price means for you
For a hypothetical home originally listed at $450,000, applying 92.7% gives a closing price of $417,150. That calculation illustrates the September 2026 metro average close-to-original-list-price ratio; it does not predict this home’s result. Original asking prices are sellers’ starting points, not independent measures of value. I would use recent comparable closings to assess a specific home’s price rather than apply the metro ratio as an automatic discount.
Sell now or wait for spring: how to decide
Here is the framework I use with clients. Work through these five questions in order.
- Do you have a deadline? If you have a job start date, a purchase closing or a lease ending, your timeline sets the month. The goal then is to sell well within that window, not to find the perfect week.
- What does waiting cost you? Add up the monthly mortgage, property taxes, insurance, utilities and upkeep on the home while it is listed or empty. Multiply by the months you would wait.
- What is the likely gain from waiting? Work out how much more a later sale would need to bring in to cover the added expense of waiting. Treat that amount as a threshold, not a promised gain. ATTOM’s national premiums compare historical closing prices with estimated values; they do not forecast the price improvement from waiting to list your Austin home.
- What will you buy next? If you are moving within Austin, the same seasonal pattern applies to your purchase. Winter can be a better time to buy, which I explain in when to buy a home in Austin.
- What is your home’s condition? If repairs, staging or decluttering would take two to three months anyway, a spring listing may be your natural target.
A worked example
Suppose, in November 2026, a seller is considering listing now or waiting until April 2027. Assume cash outflow of $2,800 a month during the 5-month wait: that totals $14,000. This is a hypothetical cash-flow illustration, not a calculation of profit. Separately, applying the national table’s 2.8-percentage-point March–October premium gap to an assumed $450,000 estimated-value base gives $12,600. ATTOM’s closing-date comparison does not establish an April gain for this seller, so comparing these amounts cannot tell us whether waiting pays.
Change the inputs and the answer changes. If the home has low carrying costs because it is paid off or rented out, waiting for spring is much cheaper. If the seller is already paying for a second home, selling now is likely the better move. That is why I run the numbers for each client rather than quoting a rule.
Reasons sellers move quickly
Many owners who sell fast do so for life reasons rather than market ones: relocation, finances, an inherited property. A breakdown of why homeowners sell fast shows how those pressures shape realistic timelines. If one of them applies to you, build your plan around your deadline and put your energy into pricing and presentation.
Perspective
We built ATXCasa around one idea: timing advice should come from current local data, not from a rule of thumb. Most articles on when to sell will tell you spring is best, and that is true as far as it goes. What they rarely do is connect it to your carrying costs, your next purchase and the price buyers are actually paying this month.
Our approach starts with Vlad’s nearly two decades in IT. We use data to set pricing, and we use AI-powered marketing to get a listing in front of as many qualified buyers as possible. In a market where homes are closing at about 92.7% of original list price, that combination matters: a price that matches recent closings and strong exposure from day one are what protect a seller’s net proceeds in any season.
We also think sellers deserve a transparent conversation. Before you pick a date, we walk through the numbers on your own home, the neighborhood trends in Austin, Cedar Park, Round Rock or Georgetown, and the pitfalls a buyer’s inspector is likely to raise. Then you choose, with the facts in front of you.
Vladimir
Working backward from your listing date
Once you have a target, count back. Here is the sequence I recommend for a spring listing in early April:
- December or January: Request a pricing review and a list of repairs worth doing. Early quotes avoid the spring contractor rush.
- January and February: Complete repairs, deep cleaning, painting and landscaping planning. Declutter and start packing what you will not need.
- Early March: Finalize your price using recent closed sales in your neighborhood, then book photography.
- Mid to late March: Go live or go to coming-soon status so you are fully in the market before the April peak.
- April and May: Hold showings, review feedback in the first two weeks, and adjust if the response is weaker than expected.
For a fall or winter listing, compress the same steps and lean harder on pricing. Buyers who are searching in these months are often motivated by a move date, and they compare payment against rate. A home that is priced correctly, shows well and has no surprises in the inspection is the one that closes.
I also keep a more detailed guide on when to sell your Austin home, and a broader piece on timing and value for 2026.
What to check before you choose a date
Before you commit, pull these figures for your own area, not only for the metro:
- Months of inventory: More supply gives buyers more choice and pushes sellers toward sharper pricing.
- Median days on market: Compare with the same month last year, using the same methodology.
- Close-to-list ratio: This shows how much negotiating room buyers are taking.
- New listings: A drop in new listings, like the 11.9% decline Realtor.com data showed in October, can mean less competition for your home.
- Mortgage rate trend: Unlock MLS reports that higher mortgage rates increased monthly payments and affordability challenges in September 2026. That finding does not establish how quickly showing traffic will change for your home.
No single figure tells you when to sell. Read them together, then connect them to your plan. If rates rise and your neighborhood shows more supply, price conservatively. If new listings fall and homes are closing close to list, you have room to hold your price.
Sell with a data-driven plan
If you are weighing a listing date in Austin, Cedar Park, Round Rock or Georgetown, we can build the numbers for your specific home: a price based on recent closings, an estimate of your carrying costs and a marketing plan designed to reach the widest pool of buyers. Start at ATXCasa and tell us your timeline, and we will show you what each option is likely to look like.

There is no cost to ask which month fits your situation. The answer may well be spring, and if it is, we will help you start preparing now.
FAQ
What is the best month to sell a house in Austin?
April is the strongest month on the days-on-market data, at a median of 51 days in 2026, with May close behind at 56. National ATTOM data puts the highest seller premium in March at 10.7%, followed by April and May at 10.2%. Being live in late March or early April covers both.
What is the hardest month to sell a home?
On national ATTOM data, October has the lowest seller premium at 7.9% over estimated value, with September at 8.0%. In Austin, January had the longest median time on market of the 2026 readings listed above, at 91 days. Sales still happen in these months, but pricing needs to be sharper.
Is now a good time to sell in Austin?
It can be, if your home is priced to recent closed sales and your timeline calls for it. September closed sales were down 14.8% year over year and homes sold at 92.7% of original list price, so buyers have leverage. If you can wait without heavy carrying costs, spring is usually stronger.
Should I wait until 2027 to sell?
Nobody can reliably predict next year’s prices, and Unlock MLS advises sellers to focus on local conditions and personal goals instead. Compare what waiting would cost you in carrying costs with the likely seasonal gain. If the two are close, your move date and next purchase should decide it.
Sources
- Table Data: Housing Inventory: Median Days on Market in Austin-Round Rock (FRED)
- September 2026 Central Texas Housing Report (Unlock MLS)
- ATTOM Best Days to Sell a Home: Spring Tops Seller Premiums
- Best time to sell a home in Austin 2026: April window (Austin American-Statesman)
- Austin home prices fell 10.2% (Austin American-Statesman)
- Austin home prices fall 9.8 percent (Houston Chronicle)
- Why Homeowners Sell Fast: Reasons and Real Timelines