
Austin has plenty of homes for sale, but not the glut of the past two years, and not enough demand to make it a seller’s market. The latest Unlock MLS report puts the Austin-Round Rock-San Marcos metro at 13,465 active listings and 5.4 months of inventory in September 2026, which is the textbook range for a balanced market. Below I explain what that number includes, why sources disagree, and how I would use it whether you are buying or selling.
TL;DR
- The Austin metro had 13,465 active listings in September 2026, 3.4% fewer than a year earlier, with 5.4 months of inventory.
- Supply is easing from its post-pandemic peak, but sales are slow too, so homes still sit and sellers still negotiate.
- Different sources report different counts and medians because they cover different areas and use different methods. Compare like with like.
- Buyers have leverage on price and terms. Sellers need pricing based on recent sold homes in their own neighborhood, not on the metro headline.
Table of Contents
- What the latest numbers say
- Months of inventory, explained
- Why the headline can mislead
- Is supply rising or falling?
- What it means if you are buying
- What it means if you are selling
- Our perspective
- Get inventory data for your own neighborhood
- How to track inventory yourself
- FAQ
- Sources
What the latest numbers say
The most complete monthly source for our area is the Central Texas Housing Report from Unlock MLS, the local multiple listing service. Here is its September 2026 snapshot for the five-county metro, as published on October 13:
| Metric (September 2026) | Value | Change vs. September 2025 |
|---|---|---|
| Active listings | 13,465 | -3.4% |
| New listings | 3,546 | +2.8% |
| Closed sales | 2,223 | -14.8% |
| Median sales price | $421,000 | +1.4% |
| Months of inventory | 5.4 | n/a |
The September report shows active listings down 3.4% from a year earlier, new listings up 2.8% and closed sales down 14.8%. It also states that rising mortgage rates weighed on market activity. These figures alone do not establish why sales declined.
The St. Louis Fed’s FRED database republishes Realtor.com’s monthly listing series for the Austin-Round Rock core-based statistical area (CBSA). The series is not adjusted for seasonal patterns and shows 12,083 active listings for September 2026. It counts active single-family and condo/townhome listings and excludes pending listings. This is a separate series from Unlock MLS; the available evidence does not establish why their counts differ.
Months of inventory, explained
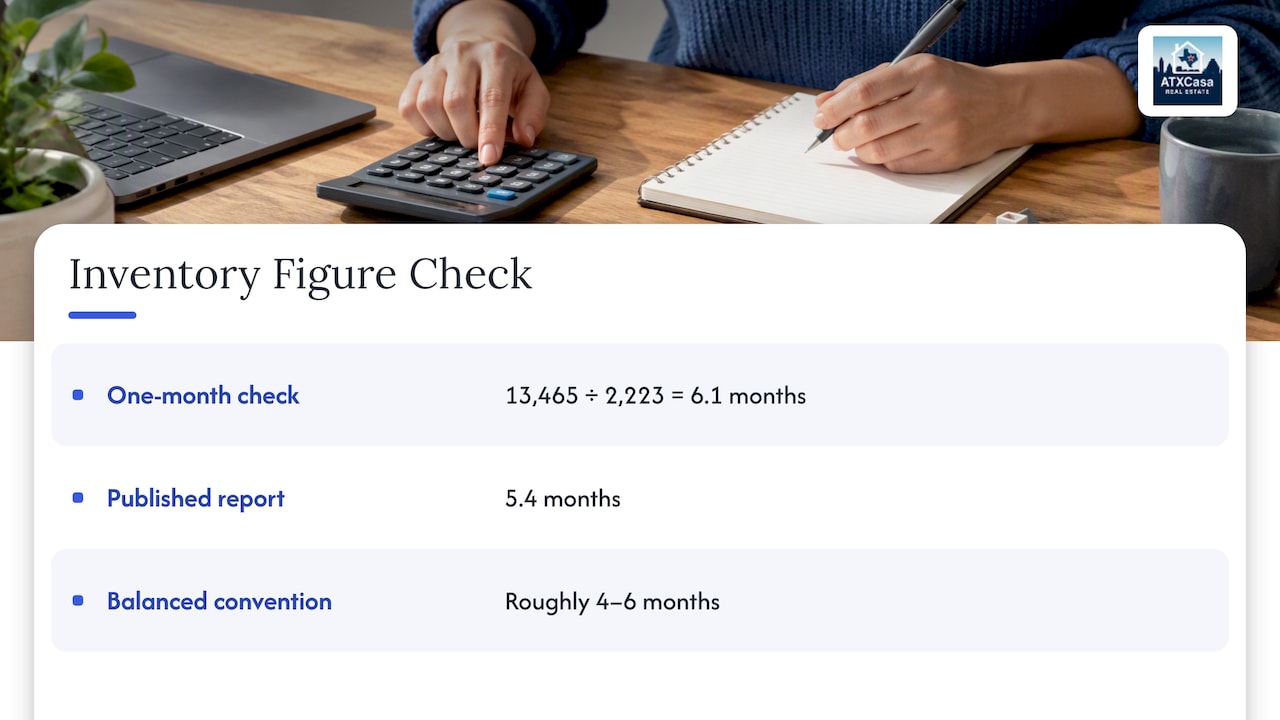
Months of inventory estimates how long it would take to sell every active listing at the current sales pace, assuming no new homes arrived. Many analysts treat roughly 4 to 6 months as balanced, under 4 as favoring sellers and above 6 as favoring buyers. Those cutoffs are a convention, not a law, and Austin’s mix of price tiers means the figure behaves differently at $350,000 than at $1.2 million.
An illustrative calculation: 13,465 active listings divided by September’s sales pace of 2,223 homes per month gives about 6.1 months. Unlock MLS reports 5.4 months, but its release does not disclose the calculation method or sales window needed to reconcile the figures. Use 5.4 months when citing the report; the simple calculation illustrates the concept without reproducing the published measure. For another worked example, our walk-through of what 4.5 months of Austin inventory means shows the calculation step by step.
Why the headline can mislead
A balanced reading does not mean every buyer and seller meets in the middle. The ALEX Intelligence recap of the Unlock MLS region argues that buyer activity metrics paint a more complex picture than headline months of inventory: supply is present, but it is struggling to find buyers willing to pay current asking prices.
That matches what the price data shows. The Realtor.com citywide page for October 2026 describes homes selling about 2.35% below asking, a 98% sale-to-list ratio, a $525,000 median listing price and 78 median days on market. In plain terms, a typical Austin seller is accepting a few percent less than the list price and waiting more than two months to do it.
Why the medians do not match
If you have seen $410,000, $421,000, $484,375 and $525,000 all described as Austin prices, none of them is wrong. They measure different things:
- $421,000: the September median sales price for the Austin-Round Rock-San Marcos metro, per Unlock MLS.
- $410,000: the median closed price for the Unlock MLS region in September, per ALEX Intelligence, across 2,636 transactions.
- $484,375: the median sold price for the city of Austin in October, per Realtor.com. The city skews higher than the surrounding suburbs.
- $525,000: a median listing price, which is what sellers ask, not what buyers pay.
The metro includes Williamson, Hays, Bastrop and Caldwell counties, where prices are generally lower than inside Austin city limits. When I compare a neighborhood, I use sold prices in that area, not a metro median. Our piece on neighborhood price patterns across the Austin metro shows how wide the spread can be.
Is supply rising or falling?
Both, depending on your starting point. Compared with the pandemic years, inventory is far higher. Compared with last year, it is flat to slightly lower. The Texas Real Estate Research Center noted in its July 2026 report that active inventory has declined moderately year over year, suggesting the worst of the overhang is easing. Its summer article adds that listings are sitting on the market much longer even as homes are no longer flying off the market as they did during the pandemic.
The May pattern is a useful example of why fewer listings do not automatically help sellers. Realtor.com reported that Austin active listings fell 13.5% year over year in May, yet prices continued to soften because demand was weaker still. Supply only favors sellers when it falls faster than buyer demand does. Right now, that is not happening.
One caution on reading the count: an active listing is not necessarily a home you could tour tomorrow. Some are under contract with contingencies, some are new construction not yet complete, and some have been relisted. I explain this in what the monthly active listing count can and cannot tell buyers.
What it means if you are buying
In a balanced, slightly buyer-leaning market, you have room to negotiate, but only if you do the work. Here is how I would approach it:
- Look at the price history, not just the price. Check how many days the home has been listed and whether it has already been reduced. Longer listing time usually means more flexibility.
- Ask for more than a lower price. Seller-paid closing costs or a mortgage rate buydown can reduce your monthly payment more than the same dollars off the price, depending on your loan. Run both numbers with your lender.
- Use inspection findings. With more choice available, a repair request or credit is a reasonable ask, not an aggressive one.
- Compare by neighborhood. A metro statistic of 5.4 months can hide a suburb at 3 months and a luxury segment at 10 or more.
- Keep your financing flexible. The September report links slower sales to rising mortgage rates, so confirm your rate lock terms before you write an offer.
For the pricing side of this, our look at Austin home prices in 2026 covers where flat prices create negotiating room.
What it means if you are selling
Sellers face the opposite problem: more competition and buyers who compare. The strongest approach is to price from what actually closed, not from what neighbors are asking.
- Start with sold data. Homes that closed in the last 60 to 90 days within a short distance of yours, adjusted for size, condition and lot, are the most reliable guide. I lay out the method in how to use Austin sold-home data to price your home.
- Do not anchor to last year’s number or to one month. Monthly figures swing, and a single reading can mislead. See how to use a monthly market signal correctly.
- Decide between a price cut and concessions early. A reduction changes your listing history permanently, while closing-cost help can keep the headline price intact. Our comparison of a price cut versus closing-cost help explains the tradeoffs.
- Make the first two weeks count. Listings draw the most attention when they are new. Pricing correctly at launch usually costs less than chasing the market down with repeated reductions.
Our perspective
We built ATXCasa on a simple observation: most buyers and sellers do not need more headlines, they need to know which number applies to them. Vlad spent nearly two decades in IT before becoming a Realtor, and that background shapes how we read inventory. We distrust any single figure, whether it is a metro median or a months-of-supply reading, until we have checked what it covers, how it is calculated and how the same measure looks in the specific neighborhood and price range our client cares about.
Our read of October 2026 is that Austin inventory is no longer the story. The story is absorption: how many buyers are willing to meet today’s prices at today’s mortgage rates. Inventory near 5 months tells you the market is not broken. It does not tell you that your home will sell at the asking price, or that you should wait for a better deal as a buyer. Those answers sit at the street level.
If we had to give one piece of advice to each side: buyers, negotiate terms as seriously as price; sellers, accept what the sold data says, even when it is lower than last year’s neighbor got. A sale that closes at a fair price beats a listing that goes stale.
— Vladimir
Get inventory data for your own neighborhood
The metro numbers above are a starting point. If you are planning to buy, sell or invest in Austin, Cedar Park, Round Rock or Georgetown, we can pull current active, pending and sold data for your specific area and price range and walk you through it. Start at ATXCasa, or see examples of recent closed transactions such as a Georgetown home we handled. For ongoing updates, our Market Insights archive tracks the local data month by month, and our Austin housing market overview puts inventory beside prices and sales.
How to track inventory yourself
You do not need a subscription to follow the trend. A routine that works:
- Check the monthly Central Texas Housing Report from Unlock MLS, which covers the metro, the city and the individual counties.
- Record four numbers each month: active listings, new listings, closed sales and months of inventory. Trends over three to six months matter more than any one reading.
- Compare against the same month last year. Austin has seasonal swings, with spring typically busier than winter.
- Narrow down. Move from metro to county to ZIP code, and from all homes to your price band and property type.
- Watch price reductions and days on market. They often signal a shift before the median price moves.
FAQ
How many homes are for sale in Austin right now?
For this October 2026 overview, the September 2026 Unlock MLS report lists 13,465 active residential listings in the Austin-Round Rock-San Marcos metro and 4,502 in the City of Austin. These are September figures, not a live count of homes available today.
Is Austin a buyer’s market or a seller’s market?
By months of inventory, it is balanced: 5.4 months in September 2026. Price signals lean toward buyers, with homes selling a little under asking and sitting longer than during the pandemic. Conditions vary by neighborhood and price range, so check your own segment.
Is Austin housing supply going up or down?
Compared with last year, active listings are slightly lower, down 3.4% in September for the metro. Compared with the pandemic period, supply is much higher. Experts at the Texas Real Estate Research Center describe the inventory overhang as beginning to ease.
Why do different websites show different inventory numbers?
They cover different geographies (city, county or five-county metro), count different property types and update on different schedules. Some also calculate months of inventory differently. Always compare figures from the same source and the same area.
Does high inventory mean prices will fall?
Not automatically. Prices depend on supply relative to demand and on mortgage rates. The September metro median price was up 1.4% year over year while citywide median sold prices in October were reported down about 10% year over year, so the answer depends on which area and measure you use.
Sources
- September 2026 Central Texas Housing Report, Unlock MLS
- Austin, TX Housing Market and Rental Trends, Realtor.com
- ABOR Region: September 2026 Market Recap and Outlook, ALEX Intelligence
- Texas Housing Insight, July 2026, Texas Real Estate Research Center
- Housing, Summer 2026, Texas Real Estate Research Center
- Real Estate Market Trends in Austin, TX, Realtor.com
- Housing Inventory: Active Listing Count in Austin-Round Rock, TX, FRED